07 Nov 2013 Top 5 new features for OBIEE 11.1.1.7.1
OBIEE’s 11.1.1.7 release has enhanced the server’s experience. Some of the new features have been long-time awaited before finally coming into light. At Clearpeaks we found some new features really worth-noting, especially when casually most of those are actually not caught at first sight. Following we present our top 5 new features with a short explanation and some screenshots.
5th: New parameters for dashboard prompted links
This release includes a bunch of new parameters to customize prompted links on dashboards such as:
Figure 5: New parameters for dashboard prompted links
- $Action=[Navigate/Print/Download] -> New actions to take by prompted link.
- &var#= -> Identifies the variable used in a variable prompt or that is set by a column prompt.
- &val[grp,sv,eval,sql]#= -> Sets the value of a prompt to a custom [group’s catalog path/server variable/presentation variable/logical SQL statement].
- &formulause#= -> Identifies whether a prompt value is a code value or a display value (in a repository that is configured for the double column feature). If you do not use this parameter, it is assumed that the value is a display value.
Required for prompts that use hierarchical columns
- &hierid#= -> Identifies the hierarchy ID.
- &dimid#= -> Identifies the dimension ID.
- &tblnm#= -> Identifies the table name.
Optional
- &cov#= -> Sets the variable of a column prompt that also sets a variable.
- &psa#= -> Identifies a primary subject area for a prompt.
Detailed documentation on params: Oracle website
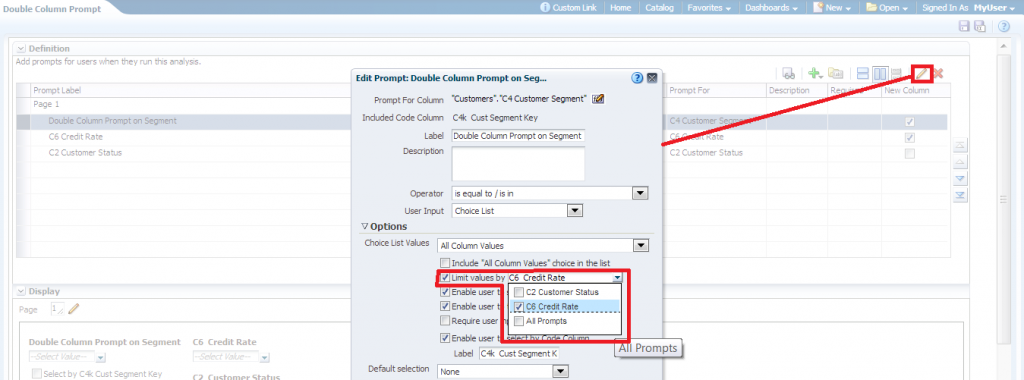
4th: Prompt constraints can now be set to be limited by more than one column
Figure 4.1: Prompts constraints limited by more than one column
This function allows related prompts to be filtered according to others in cascade. In the following example, month is limited by year, and week by month and year. The value shown is limited by multiple constraints, but we still have the option to view other unrelated date prompts. The feature of multi-selecting constraints is especially useful for viewing values defined by cascade dimensions.
Figure 4.2: Prompt constraints by cascade dimensions
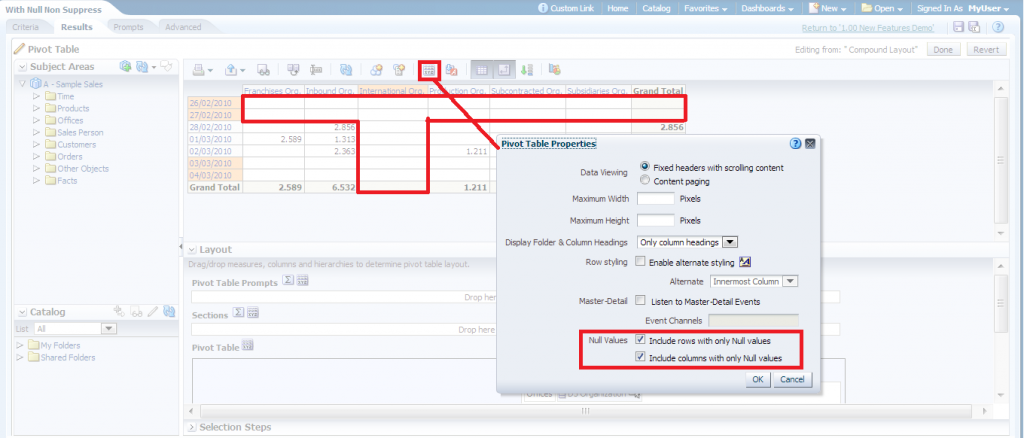
3rd: Null Row/Columns suppression
Either at analysis or at viewer level (which overrides the previous one), null suppression options can now be indicated, affecting views such as: (pivot) table, (advanced) trellis, graph, gauge and funnel views, when an entire row or column contains null values. They are simply hidden from the view. Be aware that after this change null rows and columns will be hidden by default, so you need to explicitly ask for them (slight change of logic).
Figure 3.1: Null Row/Columns suppression
Figure 3.2: Null Row/Columns suppression at analysis level
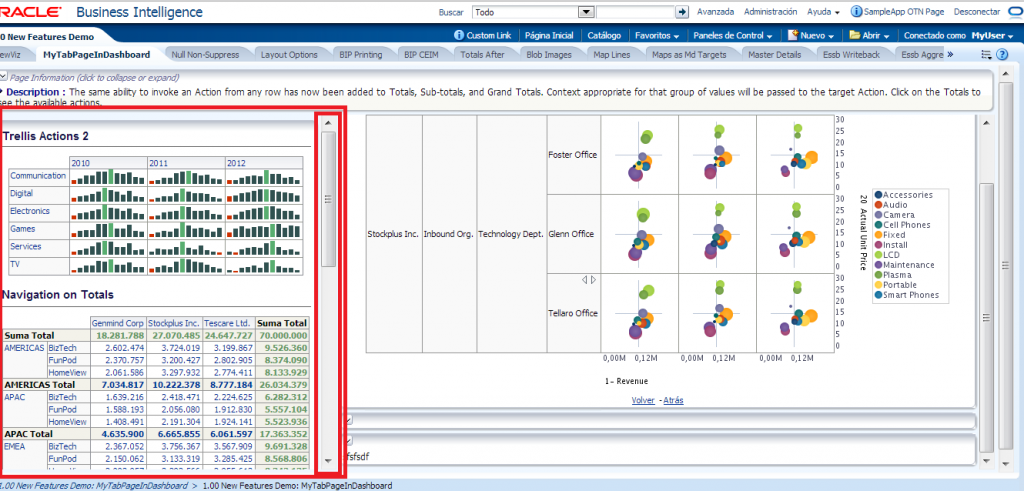
2nd: Freeze Column Option
The Column properties entry now allows you to anchor a column (or more) at any edge of a dashboard layout.
Figure 2.1: Freeze Column Option
Figure 2.2: Freezed Column
1st(our winner) Better Excel Integration
A lof of effort has been put in improving Excel integration in OBIEE. Aside from updating compatibility to recent Excel versions, a couple of add-ins have been designed for Excel to be used as a template designer and as a grapher, with direct connections to OBIEEs datasources.
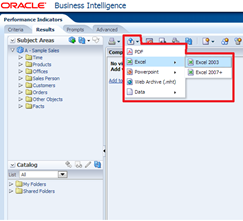
- Excel 2007+ Analysis exporting: The exporting facility is updated to the last version
Figure 1.1: Excel 2007+ Analysis exporting
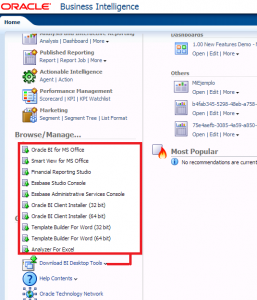
Figure 1.2: Download Links to multiple EPM tools from OBIEE Home page where 2 Excel related ones outshine (Hyperion Smart View and Template builder for Word which includes the Template Builder Add-In for Excel)
Template Builder Enhancements
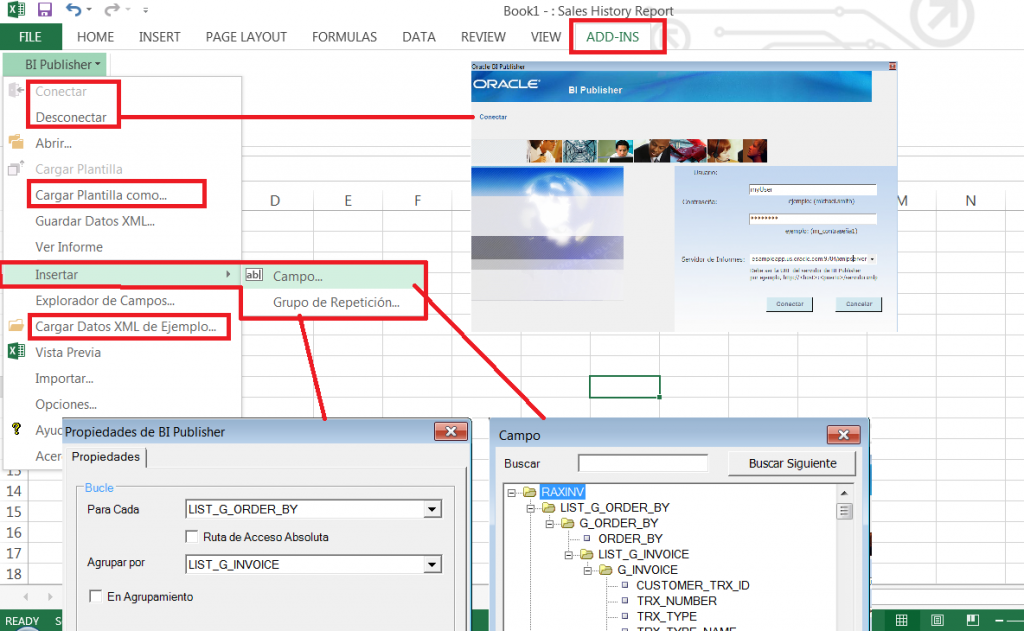
Excel template Builder comes bundled alongside Template Builder for Word tool which can be downloaded from Home page, as part of the BI Desktop Tools. It automatically installs an Add-In to Excel. Given that it already includes a function for importing Excel Analyzer templates, it can only be installed after the removal of the later. Once in Excel, you can connect directly from it to BI Publisher server to create new reports in the catalog, upload templates from your Excel session, and download sample XML data. By doing this, two new features in Template Builder are enabled. Inserting fields provides us an automatic mapping by means of a treeview selection menu of the data structure of the sample so it saves us from manually assign defined names to cells. It also fills the new cell with data from the sample just for testing purposes. Repeating groups is another feature which allows us a similar thing, that is, defining a single XML structure from data and render it as many times as the sample contains this structure.
Figure 1.3: Excel Template Builder new features
Additional info at the Oracle website and Oracle blog.
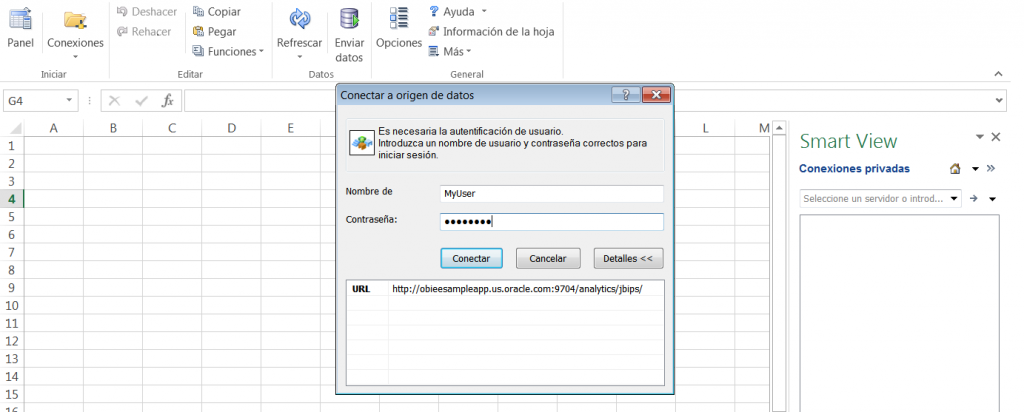
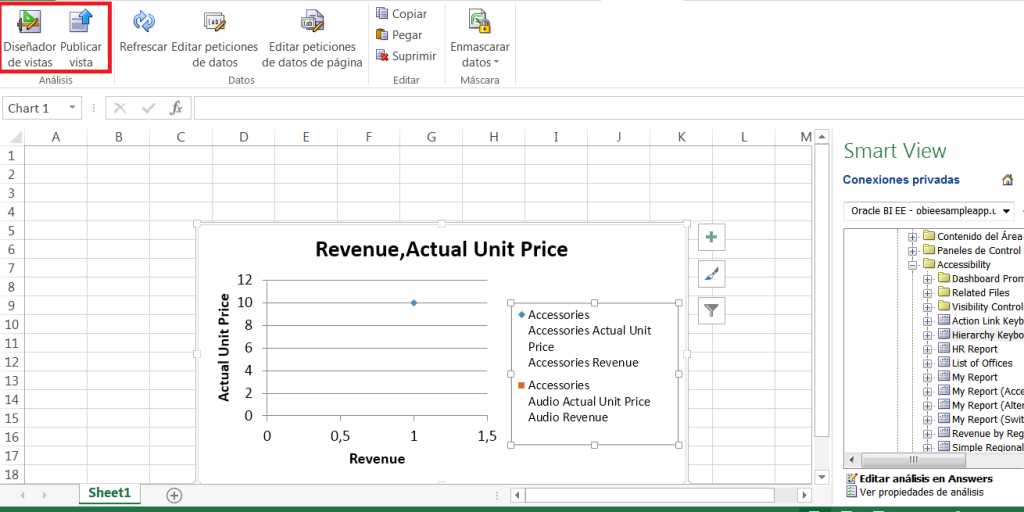
Installing Smart View for Office: Hyperion Smart View add-in for MS Office provides an integrated interface designed for OBIEE and Oracle Enterprise Performance Management. For instance, you can create new analyses from scratch in an excel file and save them in the catalogue. Old phased-out Oracle BI office is still available at install.
More info: OBIEE blog, Rittman&Mead
Figures 1.4 and 1.5: Installing Smart View for office
Bonus track: MAD and its’ custom plugins
Mobile Application Designer is one of the best features introduced in 11.1.1.7.1. It allows you to create mobile applications in a fast and simple way. However, it often lacks a certain degree of flexibility to customize the look. What a lot of people do not know is that you can code JS plugins, and use them on the interface just by dropping them in <REPOSITORY>/Admin/Plugins folder. Let´s take for instance the Youtube Plugin code to understand the structure of an expected plugin. MyYoutubePlugin.js
{
id: &quot;com.oracle.xdo.youtube&quot;,
component: {
name: &quot;Youtube Video&quot;,
cssClass: &quot;youtube&quot;,
icon: &quot;http://hostname.com/youtube_32x32.png&quot;,
tooltip: &quot;Insert Youtube Video&quot;
},
properties: [
{key: &quot;width&quot;, label:&quot;Width&quot;, type:&quot;length&quot;, value:&quot;450px&quot;},
{key: &quot;height&quot;, label:&quot;Height&quot;, type:&quot;length&quot;, value:&quot;370px&quot;},
{key: &quot;videoid&quot;, label:&quot;Video ID&quot;, type:&quot;string&quot;, value:&quot;TK7KYaCEGZU&quot;}
],
render: function(context, containerElem, rows, fields, props) {
var videoid = props[&quot;videoid&quot;];
var width = props[&quot;width&quot;];
var height = props[&quot;height&quot;];
var widthPx = xdo.api.getPixelValue(width);
var heightPx = xdo.api.getPixelValue(height);
var iframe = '&lt;iframe id=&quot;'+context.id+'_iframe&quot; style=&quot;z-index: -1;&quot; src=&quot;http://www.youtube.com/embed/'+videoid+'?wmode=transparent&quot; height=&quot;240&quot; width=&quot;320&quot;&gt;&lt;/iframe&gt;';
xdo.dom.DOMElement.set(containerElem, iframe);
}
}
Currently 2 available methods from the xdo.api are exposed uniquely in the MAD docs for their use in the main render function, xdo.api.handleClickEvent and xdo.api.getPixelValue.
There is another tag at the id/properties/render level, fields, which enables you using graphs’ typical placeholder for dropping model fields.
fields: [ {name: «labelField», caption: «Drop Label Field Here», fieldType: «label», dataType: «string»},
{name: «dataField», caption: «Drop Data Field Here», fieldType:»measure», dataType: «number», formula: «summation»} ]
We hope you enjoyed the read and would be happy if you leave us a comment on which are you favourite new features of OBIEE 7.1.


