17 Ago 2016 Tableau 10 Release!
Introduction
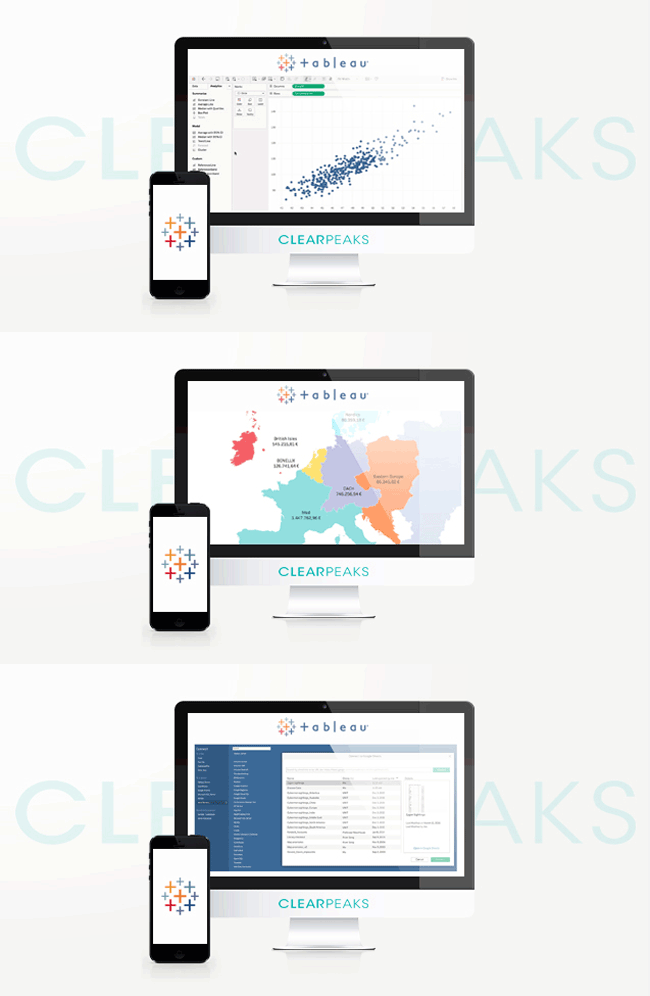
The Tableau 10 release is already here and we’d like to highlight the most important new features available in this version. Some of these features will revolutionize how we develop with the tool whilst others will make our lives much easier – just check out the cross database join functionality as an example. It also presents us with some new functionalities for Tableau final users such as the highlighter and, of course, Tableau is still improving the look and feel of the tool and its amazing visualizations, and it is now more flexible for mobile and tablet designs allowing you to consume your reports anywhere.
1. Analytics
We can detect some interesting new features in analytics. One of the most relevant is the cross data source filter – with this capability we can easily set a filter for the data sources feeding our visualizations. We can also build a cluster analysis by just dragging and dropping the functionality to our report, thus allowing the detection of patterns in the data. Finally, with the highlighter function, the dashboard consumer can mark the desired data. Other interesting functions are the custom territories, the new bar charts options available and more advanced analytics.
2. Data
In Tableau 10 we can see some big improvements in the way we interact with our data sources. The most important is the cross database join feature, which allows us to make joins between tables coming from different data sources. This will avoid data-blending in many situations and thus multiply analysis possibilities. In this version of Tableau you can also get email alerts and notifications if there is any issue when refreshing a published extract. In terms of data, there are some other new features like a connector to Google sheet and many others, enhanced maps data and more Oracle options in the connection.
3. Beauty
Tableau has also invested heavily in developing the look and feel of the tool and the resulting creations of the users. The workbook formatting feature allows you to apply a format to the entire workbook, thus saving time, and global changes are quicker. We can also see enhancements in the predefined fonts and titles.
4. Mobile
Here we can see another big improvement: the device designer feature can make a real difference as you can now define how you want to display your dashboards depending on the client’s device. You can design a different disposition of the visualization for mobile, tablet and desktop; and needless to say, there is an Android version of the mobile app.
5. Web
Here there are some improvements that offer more flexibility to web users: with web authoring it is possible to create new dashboards and add new data sources in the Tableau Server editor; with the revision history feature, the admin will be able to access the history of the published workbooks and data sources and restore or download an older version if desired. Furthermore, there’s more information on the statistics of your data sources and the publish flow to the server is now more user-friendly.
6. Enterprise
In Tableau 10 there is also space for IT perspective improvements. One of the most important is the subscribe others function, allowing you to subscribe other Tableau users to your visualizations so that they will automatically receive the view via email; there are other new features for the admins like the licensing views, new API functionalities for the developers, SAML support and sensible performance improvements.
Click here if you would like to receive more information about Tableau 10 or if you need any guidance with the migration process!


