25 Jul 2016 Summarize Tableau Server permissions in one single view
Introduction Tableau Server permissions
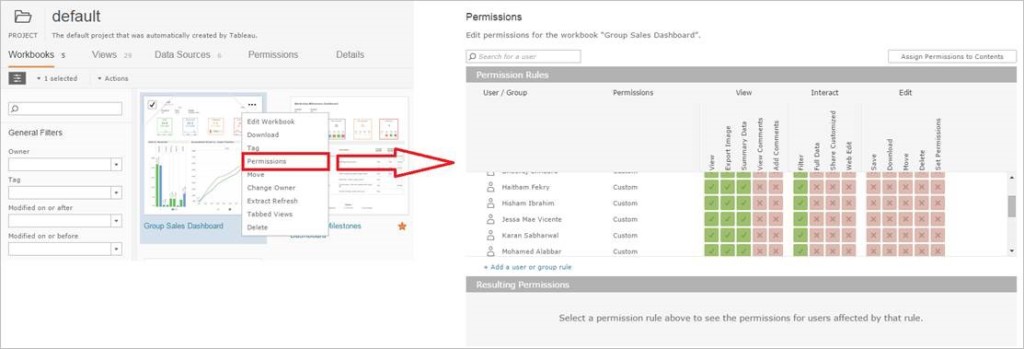
Our customers are usually interested in knowing who has access to the different elements (sites, workbooks, views…) in the Tableau Server. Only the administrator knows this information and he will need to go element by element checking the Tableau Server permissions.
Figure 1: Current Tableau Server Permissions view
Furthermore, this information cannot be exported to any format, so in case we want to create a report, we will have to copy all the names manually. This work can become tedious, especially when the number of workbooks and users grows.
Our solution consists in a Permissions Dashboard that will allow us to have all the Tableau permissions organized by Site, Project, View and User. As all Tableau dashboards, it can also be exported to different formats.
1. Understanding the Tableau Server database
By connecting to PostgreSQL Tableau Server database, we will be able to get to all the necessary information to monitor the Tableau Server (i.e. user actions, permissions, logins, performance, etc).
In order to understand our solution, we recommend you to check what the PostgreSQL Tableau Server database offers:
➜ Create Custom Administrative Views: https://onlinehelp.tableau.com/current/server/en-us/adminview_postgres.htm
➜ Data Dictionary: https://onlinehelp.tableau.com/current/server/en-us/data_dictionary.html
➜ Enable external access to «Tableau» and «readonly» users: https://onlinehelp.tableau.com/current/server/en-us/adminview_postgres_access.htm
2. Connecting the Tableau Desktop to Tableau Server Database
As the Tableau Server is a PostgreSQL database, you will need to set a new PostgreSQL connection.
Click here to find out how to connect to the Tableau Server Database!
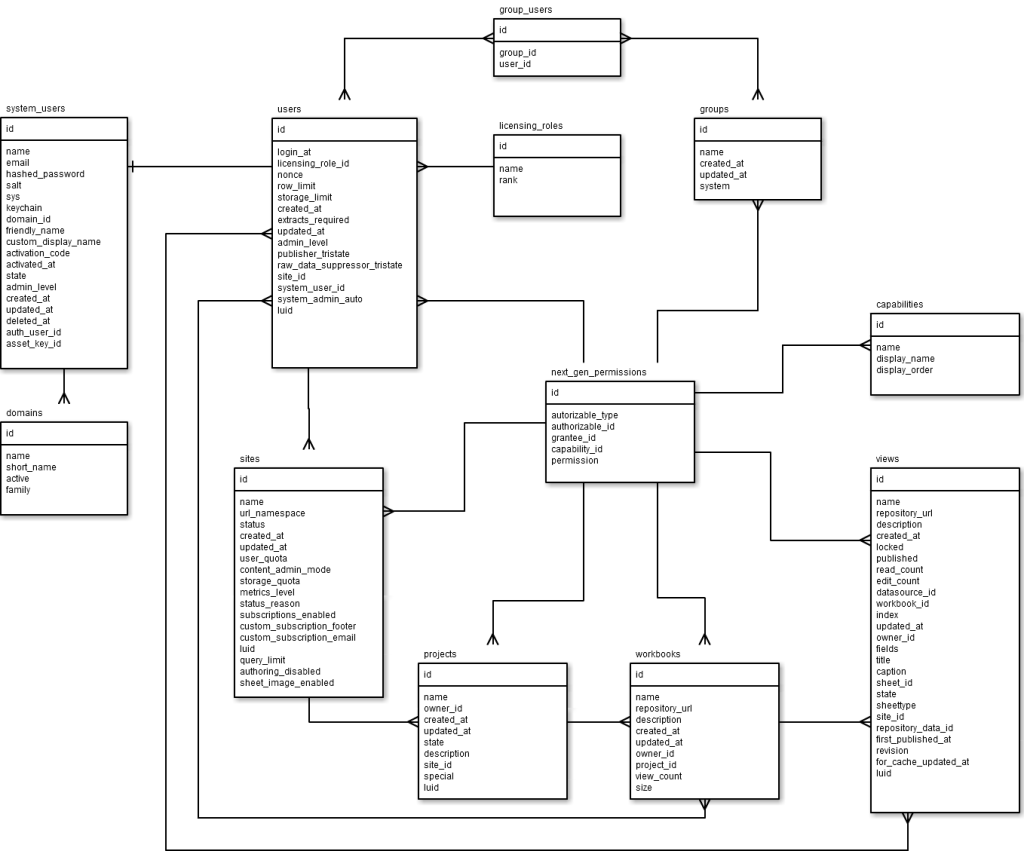
In order to get permissions information, we will need to query the following tables:
| next_gen_permissions | capabilities | licensing_roles |
| users | workbooks | domains |
| system_users | sites | group_users |
| views | projects | groups |
I recommend you to use a Custom SQL statement as follows:
SELECT DISTINCT * FROM (
    /** User views **/
    SELECT  s.name as Site,
            p.name as Project,
            w.name as Workbook,
            v.name as View,
            su.friendly_name as User
    FROM    next_gen_permissions ngp,
            users u,
            system_users su,
            views v,
            capabilities c,
            workbooks w,
            sites s,
            projects p
    WHERE   ngp.grantee_id = u.id
            and u.system_user_id = su.id
            and ngp.authorizable_id = v.id
            and ngp.capability_id = c.id
            and v.workbook_id = w.id
            and v.site_id = s.id
            and p.id = w.project_id
            and ngp.grantee_type = 'User'
            and ngp.authorizable_type = 'View'
            and c.name = 'read'

    UNION ALL

    /** Group views **/
    SELECT  s.name as Site,
            p.name as Project,
            w.name as Workbook,
            v.name as View,
            uig.friendly_name as user
    FROM    next_gen_permissions ngp,
            views v,
            capabilities c,
            workbooks w,
            sites s,
            projects p,
            (SELECT system_users.friendly_name,
                    groups.id as group_id
            FROM    system_users, users, licensing_roles, domains, group_users, groups
            WHERE   users.system_user_id = system_users.id
                    and users.licensing_role_id = licensing_roles.id
                    and	system_users.domain_id = domains.id
                    and	group_users.user_id = users.id
                    and	group_users.group_id = groups.id) uig
    WHERE   ngp.grantee_id = uig.group_id
            and ngp.authorizable_id = v.id
            and ngp.capability_id = c.id
            and v.workbook_id = w.id
            and v.site_id = s.id
            and p.id = w.project_id
            and ngp.grantee_type = 'Group'
            and ngp.authorizable_type = 'View'
            and c.name = 'read'
) as Workbook_Permissions |
Figure 2: ER Diagram of the involved tables
3. Building the Dashboard
Once we have the Data Source set, building the dashboard is straight forward. Find below a few tips that will improve the usability.
3.1 Manually: Adding an option to the mapping
Create a hierarchy that will allow us to drill down from site level to view level:
Figure 3: Site-Project-Workbook-View Hierarchy
Place the hierarchy in the columns shelf and the User in Rows shelf as follows:
Figure 4: Columns & Rows shelfs
This hierarchy will allow us to have the access summarized at site level and also detailed at View level without navigations.
3.2 Filters
The filters will be defined according to our dimensions: Site, Project, Workbook and User.
Figure 5: Filters applied
3.3 Numbers of views
As the granularity of our dashboard is view, therefore the Number of records metric will show us the total views of each user at any level of the hierarchy. The value is shown in the tool-tip and also next to the blue shape.
Figure 6: View at Site & Workbook levels
Conclusion
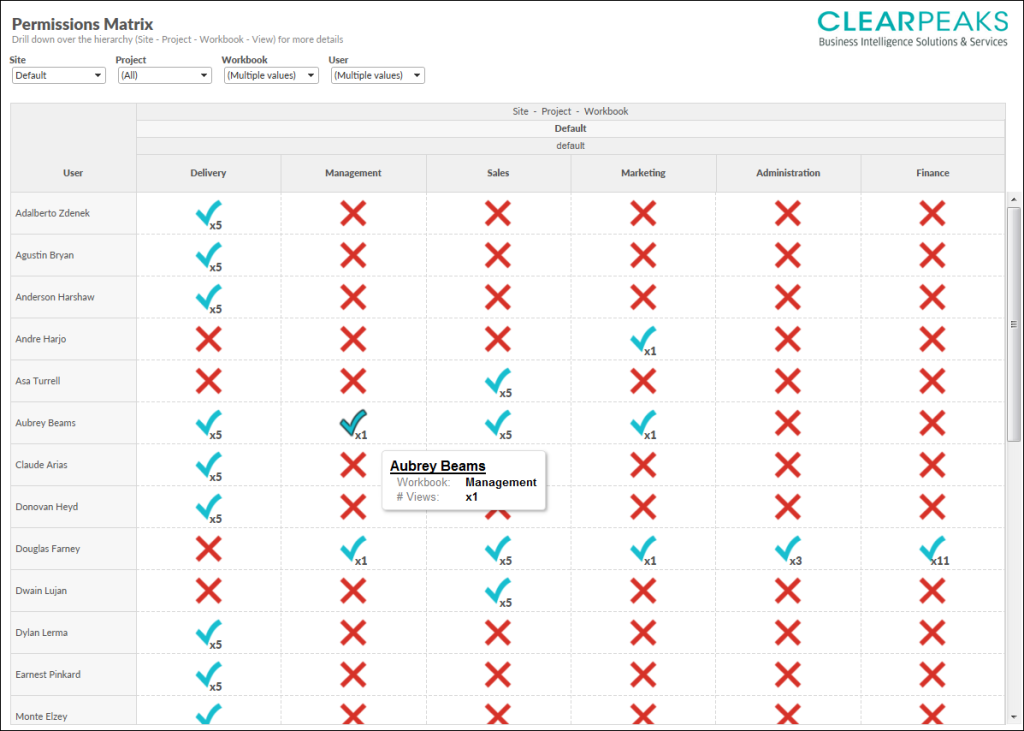
To summarize, after customizing it with our logo and our colours, this is how the permissions dashboard looks like:
Figure 7: Customized permissions view
We can see for every element in the dashboard, who has access (blue shape) and who has not (red cross).
We have set a live connection, so all the data is always updated, keeping the permissions under control in one single view. Furthermore, this information can be shared by publishing the workbook in Tableau Server or by using the export option.
In conclusion, this dashboard is a useful solution to keep all the permissions under control in one single view. This will help us to ensure every user has the correct access increasing the security and maintainability of our Tableau Server.
Click here if you would like to receive more information about the topic!


