02 Mar 2022 Solving Complex Table Requirement Challenges Using AG Grid
Tired of creating new tables with complex requirements? Here is AG Grid!
In this article we are going to talk about a solution that we have implemented for a client using AG Grid, a JavaScript library that simplifies creating complex tables. No more time wasted checking performance or coding functionalities like sorting, pagination, or filtering, because AG Grid tables integrate it all! (Example: https://www.ag-grid.com/example/)
What is AG Grid?
AG Grid is a highly customisable table library for JavaScript. It has no third-party dependencies and it’s easy to integrate with all major JavaScript frameworks like React, Vue or Angular, with outstanding performance.
Main functionalities:
- Highly customisable.
- Amazing performance.
- No third-party dependencies.
- Easy to integrate.
- Live streaming updates.
- Integrated charting.
Requirements
The customer requested a new web page with multiple tables and charts showing information on the user’s performance by company.
When we knew that we had to work with multiple tables and lots of rows of information coming from different endpoints, and then make it look great without losing performance, we decided to use AG Grid.
One of the main reasons for this choice was the nested rows functionality called “Tree data”, included in AG Grid Enterprise version. You can find more information here.
The customer’s requirements were as follows:
- Display multiple tables populated with data received from different endpoints.
- Some tables will need nested rows to create user or company hierarchies.
- One table will need to show the user’s profile image, loading from an endpoint.
- Other tables will need sticky bottom rows.
- Almost all row styles come from endpoints.
Solution
In our case we used a front-end web application that works with Angular, and we needed to integrate AG Grid. These are the steps we followed, using NPM:
npm install --save AG Grid-community

npm install --save AG Grid-enterprise
After researching how AG Grid works, we decided to create a base Angular component to use with the different tables we needed to create. Our base component had some configuration options, like the column names, the data, the styles, and whether it will have a sticky bottom row.
This way we only need to get the data from the correspondent endpoint and prepare it to fit the table data requirements, like calculating the total sum result of one column, or setting the styles retrieved from our endpoints. Then we send the final data object to our base AG Grid component, and the table is ready!
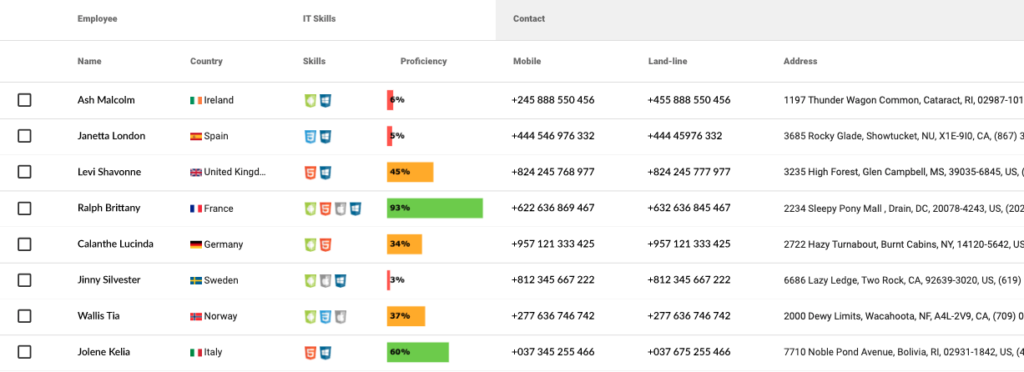
Here is an example image of a table from the dashboard:
One challenge we faced was trying to load employee profile images to each row. We had to create a custom AG Grid component to be able to show employee profile pictures with the employee’s name.
On the first try the images loaded correctly but they stopped working when we scrolled the table. That was because AG Grid removes the row when it is not displayed and creates it again when we scroll back. The solution was to save the image in cache ready for each time the row is created.
Conclusion
As we’ve seen, integrating and using AG Grid in a project is easier than it looks. Our approach of working with a base component that fits almost all types of tables in your project is the best solution, avoiding the creation of multiple table components and resulting in clean, unified, and understandable code.
If you’d like to build custom embedded Web & Mobile BI experiences for your organisation, contact us to find out how we can help you!


