04 Feb 2025 Reviewing AI Assistant in Cloudera Data Visualization
In our previous blog post, we delved into the creation of a Retrieval-Augmented Generation (RAG) LLM chatbot using Cloudera Machine Learning (now Cloudera AI), showcasing the transformative potential of LLMs in enhancing data interactions. In this blog post, we continue our exploration of the applications of LLMs within the Cloudera ecosystem, turning our attention to an exciting integration within Cloudera Data Visualization (DataViz): AI Assistant. We will demonstrate how integrating LLM with the AI Assistant within Cloudera Data Visualization can improve the way you interact with and derive insights from your data, making complex analysis accessible and intuitive for all.
DataViz is a data visualisation tool from Cloudera Data Platform (CDP), inside the Cloudera Data Warehouse (CDW) and Cloudera AI Data Services. Like other CDP components, it is secured by Cloudera’s Shared Data Experience (SDX). DataViz allows you to create visuals across various data sources in CDP within a single dashboard or application. For example, you can build a dashboard that integrates a donut chart from a Hive data warehouse table, a collection with search history from Solr (currently in tech preview), and prediction results from a deployed ML model.
AI Assistant
With Cloudera Data Visualization 7.2.0, Cloudera introduced the AI Assistant visual, providing a natural language interface for interacting with dashboards and datasets. Leveraging text input and speech detection combined with interactive data visualisation, the AI Assistant is an intuitive tool to gain insights through interactive conversations about the data.
Once configured and added to the dashboard, the AI Assistant visual connects to a vector database such as Solr (though SQLite or CSV are also possible for small datasets). You can interact with AI Assistant by typing a question into the text box. Your user query is sent to a large language completion model, specified in the application settings, which processes the information and displays the results as a text response within the visual. You can then ask follow-up questions or refine your queries, with the system continuously offering additional insights by updating the visualisations.
To delve deeper into the underlying data, you can click on the info button. This feature offers insightful visual dashboards and reports, combined with an additional layer of contextual intelligence through the AI visual for a comprehensive business intelligence workflow.
Now we’ll show you how to create a simple DataViz application in Cloudera AI; once that’s done, we’ll use it to review the features of AI Assistant through a simple dataset.
Setting up AI Assistant
Before starting the implementation of AI Assistant within DataViz in Cloudera AI, ensure the following prerequisites are fulfilled:
- TLS-enabled CDP with Cloudera AI installed.
- Data Visualization runtime version 7.2.0 or later.
- Deployed Completion Model and Embeddings Model with available APIs.
Deploying a DataViz Application in Cloudera AI
- Create a New Project in Cloudera AI, set Cloudera Data Visualization Runtime for the project in the Runtime setup section.
- Navigate to Applications in the left sidebar, click on New Application and enter the following details:
- Name: DataViz AI Assistant
- Subdomain: dataviz-ai-assistant
- Description: Demo for DataViz AI Assistant
- Script: /opt/vizapps/tools/arcviz/startup_app.py
- Runtime:
- Editor: Select Workbench
- Kernel: Select Cloudera Data Visualization for the kernel supported by the Runtime variant of the Cloudera AI project
- Edition: Select the Edition of the Runtime variant (>=7.2.0) for the application
- Click on Create Application. In a few minutes, a fully functional data visualisation platform will be hosted. To make changes, click on Application Details and go to the Settings tab.
- For further details, refer to Deploying a CDV application in Cloudera AI.
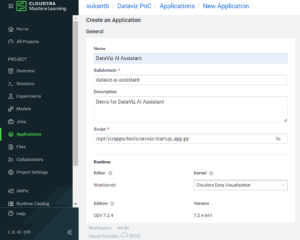
Figure 1: Deploying a DataViz Application in Cloudera AI
Configuring AI Assistant in the DataViz Application
- Launch the application.
- Enable the AI Assistant feature in the Site Settings.
- Select the AI engine and configure the necessary settings. For instructions, see Managing AI settings.
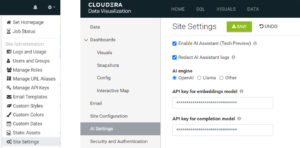
Figure 2: Configuring AI Assistant
Reviewing AI Assistant
DataViz is equipped with numerous features to build visual applications. To review the AI Assistant visual, we created a simple dashboard with a couple of visuals.
Embeddings Model and Large Language Model
DataViz offers seamless integration with various LLMs, including OpenAI, LLaMa, or any other LLM deployed in an environment, provided the user has the API key. In our implementation, we used the gpt-35-turbo and text-embedding-ada-002 models deployed in Azure OpenAI Studio:
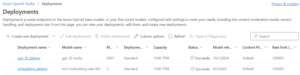
Figure 3: Model Deployments in Azure OpenAI Studio
Since the models were deployed inside the Azure environment, we could not use the API keys by selecting OpenAI as the AI engine. Instead, we selected Other and entered the following parameters:
- API key for Embeddings model
- API key for Completion model
- Endpoint for Embeddings model
- Endpoint for Completion model
- In the AI engine settings, provide a custom transformer function to handle the authorisation header
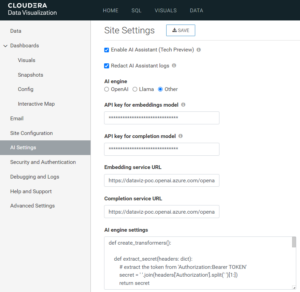
Figure 4: Configuring Deployed Models in DataViz
Data Preparation
We sourced sample bank customer data from Kaggle (Bank Customer Churn). To use AI Assistant, this data had to be vectorised. We developed a Python script in Cloudera AI to transform each row into a dictionary with column names and values as key-value pairs separated by a delimiter. Using the embeddings model API, we generated embeddings for this dictionary and stored them into a column. The processed data appears as shown below:
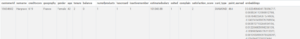
Figure 5: Processed Data
In the Data tab within DataViz, we check that a data connection is configured for a data source that supports columns of vector type. Since we want to test AI Assistant with multiple types of sources, we store the processed data both in a CSV and in Solr, and configure data connections for both (note that CSV is recommended only for small datasets):
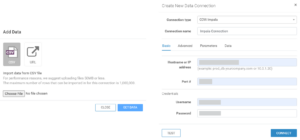
Figure 6: Connecting to Data Sources in DataViz
Data Visualisation
In the Visuals tab, we create a new dashboard and add an AI Assistant visual. The AI Assistant visual has the following shelves:
- Embeddings: Used for vector database comparisons. User input is vectorised and compared to the defined embeddings to get the most similar rows. Add a Dimension or Measures vector field that contains embeddings. This is a mandatory shelf that accepts multiple fields. Drag the embeddings column(s) created during the data preparation step into this shelf.
- Embedding Context: Add fields to send as part of the chat prompt as a formatted version of all embedding context data. This is a mandatory shelf that accepts multiple fields.
- Tooltip: Enables the addition of a field for source information to be included in the displayed results. This shelf is limited to one field for the AI Assistant visual type.
- Limit: Defines the number of data rows processed by the visual.
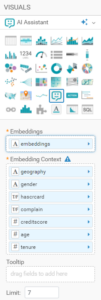
Figure 7: Visualisation with AI Assistant
Interaction
When you interact with AI Assistant, DataViz processes the query using an embeddings model. This model converts your input into vector embeddings, which are then used to perform a similarity search in a vector database to retrieve relevant contextual information. Once the relevant data is identified, the query, along with the search results, is sent to a completion model, which generates a response based on the provided context. This response is then displayed in the AI Assistant chatbot. The flow of data is represented here:
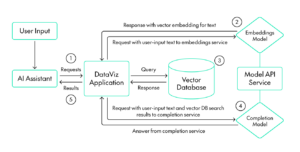
Figure 8: Data Flow for AI Assistant
In addition to AI Assistant, you can design and add other visuals within the dashboard. While these visuals are not generated by the assistant, they can be dynamically linked to it, which means that as you ask questions, the corresponding visuals in the dashboard can update in real time to reflect AI Assistant’s response, offering additional data to support the insights provided by the AI.
This seamless integration of LLMs with visual analytics offers a richer, more interactive experience, enabling the discovery of insights through both conversation and dynamic visualisations.
We tested AI Assistant using both CSV and Solr as sources. Below we can see some of the interactions:
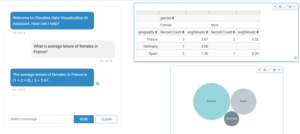
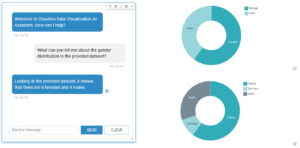
Figure 9: Sample Output with CSV Dataset
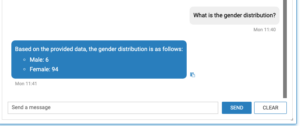
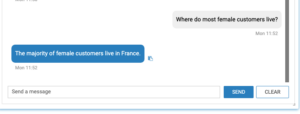
Figure 10: Sample Output with Solr Dataset
Conclusion
In this blog post, we’ve reviewed the new AI Assistant visual in Cloudera Data Visualization by building a quick application using a Large Language Model deployed in Azure OpenAI Studio. With AI Assistant, you can now use natural language to derive insights about your datasets effortlessly, so it’s no surprise that this innovative visual is narrowing the gap between DataViz and other leading BI tools in the market.
If you’re looking to explore how Cloudera Data Visualization can transform your business intelligence strategy or want to enhance your organisation’s analytics capabilities, simply contact us! Our experienced and certified Cloudera consultants can architect and deploy the right set of tools to help you leverage the full potential of your data.