
01 Aug 2017 Real Time Business Intelligence with Azure and Power BI
The purpose of this blog article is to analyse the increasing need for real time solutions applied to BI platforms. We will first understand the context and then present a user case and its corresponding solution. The technical development takes advantage of the Event Hub, Stream Analytics and SQL Database services of Microsoft Azure, together with visualisations in Power BI.
1. Traditional and Real Time BI
Traditionally, a BI solution consists of a centralized DWH that is loaded incrementally in batches. The most common approach is to run the ETL process once a day, outside of working hours, to avoid undesired workloads and performance issues on the source transactional systems. The main drawback of this approach is that the information analysed by business users is always slightly outdated. In most cases, business processes can be successfully analysed even if the available information is from previous days.
However, in recent years, the number of business processes that require real-time monitoring has increased dramatically. Fraud detection, sensor networks, call centre overloads, mobile traffic monitoring, and transport fleet geolocation are just a few examples of where real-time analysis has transformed from a luxury to a necessity.
To understand the difference between traditional and real-time BI necessities, let’s use the Value-Time Curve, as proposed by Richard Hackathorn. This curve represents the value of an action initiated by a business event along time.
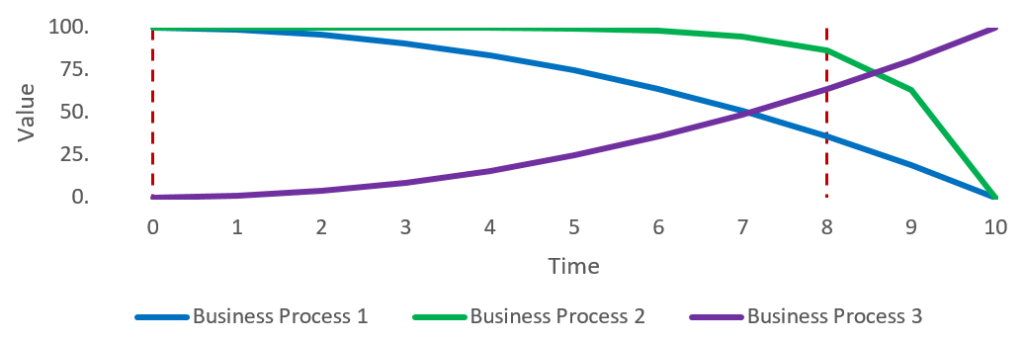 |
Figure 1: Value-Time curve for business processes, as proposed by Richard Hackathorn |
In the figure above, we can see different types of business processes. In all cases, there is an event happening at time 0 and an action triggered at time 8. We can see that:
| • | For business process 1, the decay is quadratic, so we are losing value from the very beginning. |
| • | For business process 2, the decay is exponential, so we don’t lose much value at the beginning, but there is a sudden drop in value at one point in time. |
| • | For business process 3, the increase is exponential, so, in contrast to the previous cases, the value of the action increases with time. |
In these examples, a real-time action is especially critical for Business Process 1, while traditional BI with a batch incremental load can be enough for Business Process 2. The special case of Business Process 3 is clearly not suitable for real-time analytics. Considering these special business processes, BI is starting to adopt solutions that provide real-time analytic capabilities to business users. The key objective of these solutions is to reduce the latency between the event generated by the business process and the corresponding actions taken by business users.
2. Case Study Overview
For this case study, we are using an open data feed provided by Network Rail, the owner of a large part of the rail network of England, Scotland and Wales. From all their feeds, we selected the Real Time PPM (Public Performance Measure), with the following characteristics:
| • | The feed is provided in JSON format |
| • | The data is provided on a 60 seconds basis for around 120 rail services |
| • | PPM is measuring the ratio of delayed to total trains |
| • | Along with PPM, the total number of on-time, delayed and very late trains are provided |
In this case study, we consider the data for each service and minute as a business event. This means that the feed provides around 120 events per minute. This is around 2 events per second. As this event rate is a bit low for analysing the limitations of a real-time solution, we built an event interpolator, which basically takes 2 consecutive feeds and generates interpolated events at a higher rate.
3. Solution Design and Development
The overall architecture of the solution is as displayed in the below figure and is explained in the following sections:
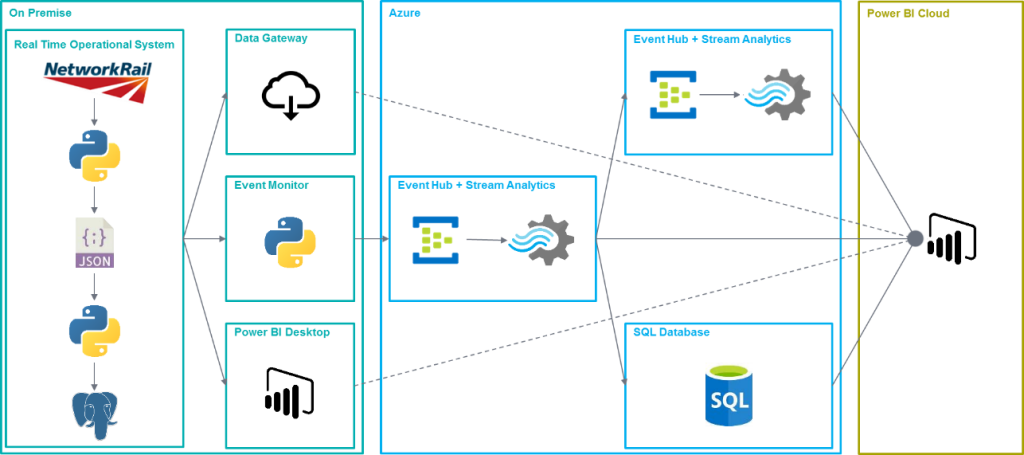 |
Figure 2: Realtime BI solution design diagram |
4. On Premise
Using the data feed provided by Network Rail, we simulated an Operational System with continuous data events. This module does the following operations:
| • | A feed receiver script downloads the feed every minute using the Network Rail API and stores a JSON file in the server |
| • | A feed splitter script reads the JSON files and, if required, interpolates the data to create events at a higher frequency. Finally, it inserts the data in a PostgreSQL database. |
| • | In the PostgreSQL, a trigger calls a custom function every time a row is inserted in the operational table. This function launches a notification including the data of the new row in JSON format. |
Once the Operational System is ready, we setup an Event Monitor, which does the following:
| • | An event monitor script listens to the notifications created by the PostgreSQL database and sends these events to an Azure Event Hub. If required, the script can encapsulate multiple events in one single message sent to the Event Hub. We will explain in detail the necessity of this feature later on. |
Apart from the elements explained above, which compose the main information flow in the scenario, we also used other elements in our development:
| • | We used Power BI Desktop to connect to the PostgreSQL database locally and analyse the events being inserted. |
| • | We also installed the Power BI Data Gateway and configured it so that we were able to connect to our on-premises PostgreSQL database from Power BI Online |
5. Azure
Microsoft’s cloud ecosystem Azure offers a plethora of services — many of them oriented to the BI/Data market. Among them, some services are specially designed for real time applications. In this solution, we have used the following services from Azure:
| • | Event Hub, which is a cloud end-point capable of receiving, queueing and storing (temporally) millions of events per second. |
| • | Stream Analytics, which allows the querying and analysing of real time events coming from an Event Hub and sends them to a variety of services like Power BI, SQL Databases and even other Event Hubs. |
| • | SQL Database, which is a transparent and scalable database that works as a classical SQL Server. |
In this scenario, we are using an Event Hub as the single entry point of events. That is, our on-premises event monitor script is using the Azure SDK for Python to connect to the Azure Service Bus and to send the events to this Event Hub. It is very straightforward to send events using the API. In our case, as the PostgreSQL notifications are sending a JSON object, we have to pass it to the Event Hub with very limited manipulation (just adding a few timestamps for monitoring). As we introduced before, the event monitor can encapsulate multiple events to reduce the number of messages to be sent to the Event Hub. The reason to do this is that, despite the ingest throughput of the Event Hub being high (and scalable if required), the network latency impacts the number of events we can send. Basically, each event sent is a call to the REST API of the Event Hub, which means that until a response is received, the process is blocked. Depending on the network latency, this can take a long time and limit the overall application throughput. Luckily, the Event Hub API allows encapsulating multiple events in one message. To do this we create a JSON Array and push multiple event objects into it. The Event Hub is able to extract each individual event and process it independently.
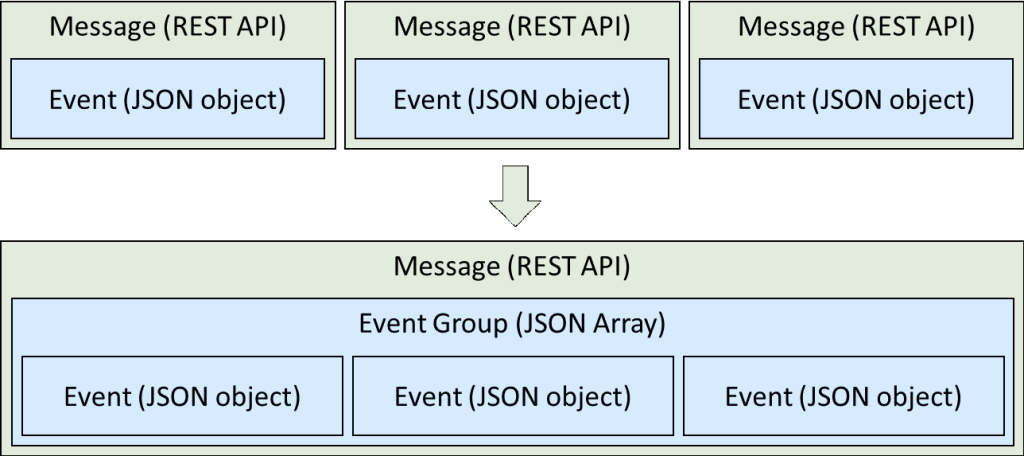 |
Figure 3: Schematic view of multiple events encapsulated into one packet to overcome the limitation imposed by network latency |
By increasing the number of events per message, we can overcome the network latency limitation, as shown in the figure below. It is also important to select correctly the Azure Region where we deploy our services, so that latency is minimised. There are online services that can estimate the latency to different regions. However, it is always better to test it for each specific case and environment.
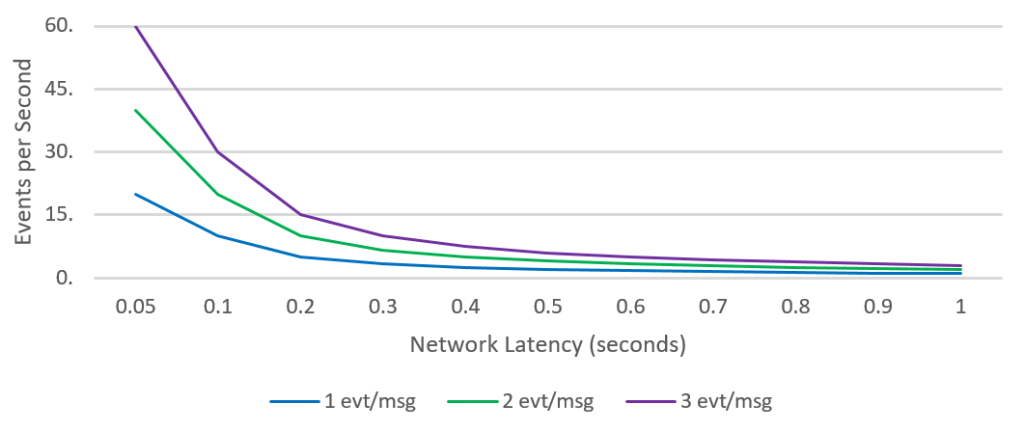 |
Figure 4: As the number of events per packet increases, the system can deal with higher network latencies. |
Once the stream is queued by the Event Hub, we can use it as the input of a Stream Analytics service. With this service we can apply SQL-like queries to our stream of events and create aggregates and other calculations. Two of the most important points of the queries are the Timestamp and Time Window functions. See the example below:
SELECT
operatorName,
AVG(ppm) avgPpm
INTO powerBIOutput1
FROM eventHubInput1
TIMESTAMP BY eventDate
GROUP BY operatorName, TUMBLINGWINDOW(second, 5)
In this query we are doing the following:
| • | Reading data from the eventHubInput1 input |
| • | Aggregating the ppm metric by applying an average |
| • | Applying a Timestamp to the input stream using the eventDate column |
| • | Grouping the values for each operatorName using a tumblingwindow of 5 seconds |
| • | Sending the result to the powerBIOutput1 output |
There are 3 types of Time Windows that can be applied in Stream Analytics, but the most common one is the Tumbling Window, which uses non-overlapping time windows to aggregate the events. The data processes in the Stream Analytics are then forwarded to the following outputs:
| • | Other Event Hubs and Stream Analytics so that more complex aggregations can be created. In our case, we used this pipe to create a Bottom 10 aggregation. |
| • | An Azure SQL Database service to store the values. We are using it to store the last 1 hour of data. |
| • | Power BI Cloud as a Streaming Dataset for real-time analysis. |
6. Power BI Cloud
As explained before, one of the outputs from Azure Stream Analytics is Power BI Cloud. When we create this type of output, one Power BI account is authorized to access the stream. Automatically, when the data starts to flow, the new stream will be added to the Streaming Datasets section in Power BI Cloud:
 |
Figure 5: Real time datasets of Power BI generated in Stream Analytics |
Once our Streaming Dataset is ready, we can create real-time visualizations, using the Real-Time Data Tiles that can be added to any of our dashboards, and select the appropriate dataset and visualisation:
 |
Figure 6: Process of adding a streaming tile to a Power BI dashboard |
At the time of writing this article, the following visualisations are available:
| • | Card |
| • | Gauge |
| • | Line |
| • | Bar |
| • | Column |
The Real-Time Data Tiles are automatically refreshed depending on the Windowing applied to the incoming dataset in Stream Analytics. In the query shown above, we were applying a Tumbling Window of 5 seconds, so the data in the tiles will be refreshed accordingly:
 |
Figure 7: Streaming tiles showing real time data coming from Stream Analytics |
The main drawback that we have experienced with real-time visualisations is that they are currently limited both in terms of quantity and customisation, as compared to the Power BI reports that we can create with standard datasets. We believe this is due to the relatively early stage of development of these visualisations. To overcome this issue, we also tested the Direct Query feature, which allows direct connection to the data source without prefetching the data. We can use this feature only with some technologies, including on-premises and cloud databases. In our case, we tested the following scenarios:
| • | On-premises SQL Server through Power BI Data Gateway |
| • | Azure SQL Database |
For this type of datasets, we can configure a cache refresh interval, which, as of today, is limited to 15 minutes.
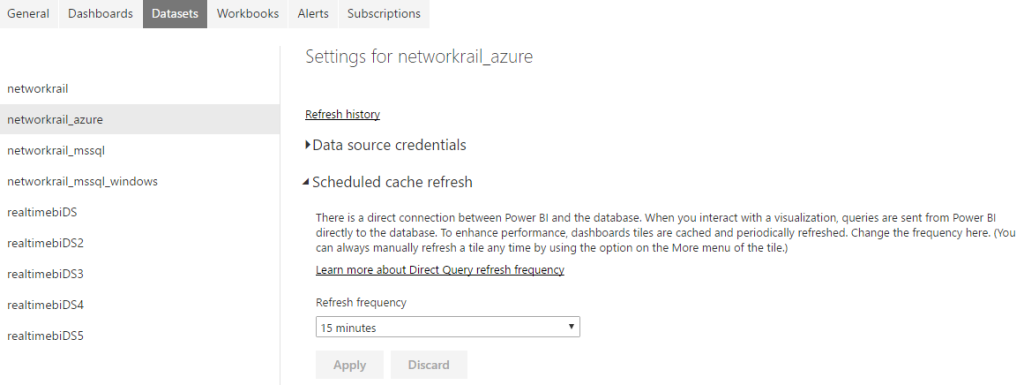 |
Figure 8: Setting up the refresh schedule of a Direct Query dataset |
The reports that we create using these data sources will be automatically refreshed at the specified frequency:
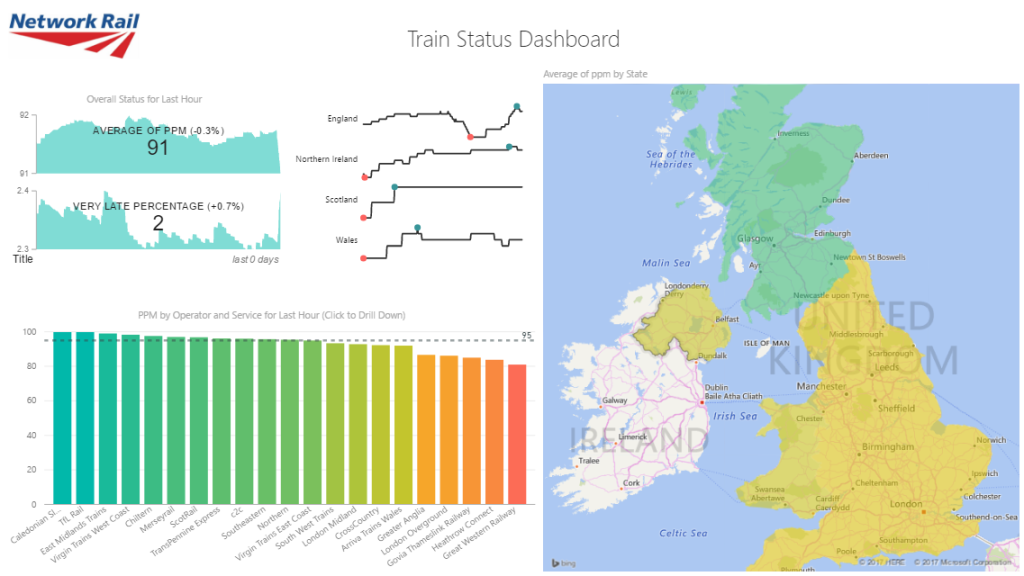 |
Figure 9: Power BI report created using the Azure SQL Database data with Direct Query |
The combination of Real-Time Data Tiles using Streaming Datasets and Reports using Datasets with Direct Query, both on-premises and on Azure, provides the best results for a real-time BI dashboard in Power BI.
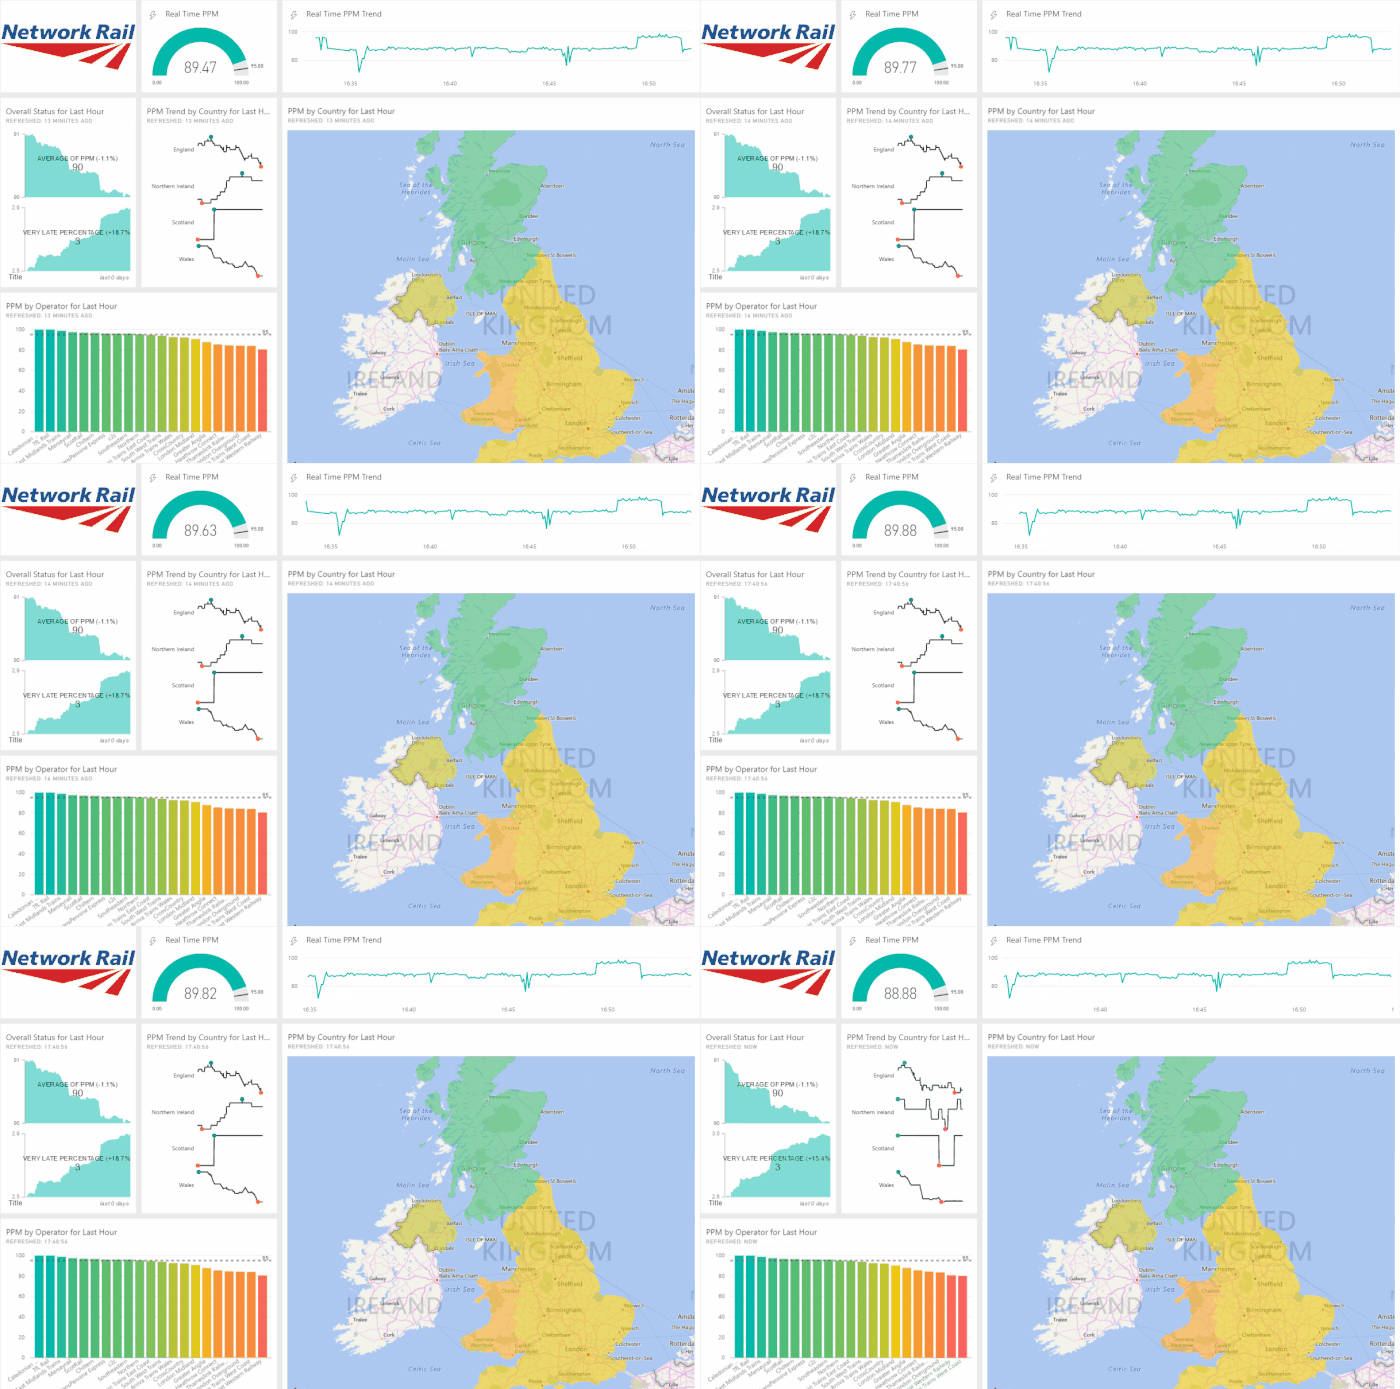 |
Figure 10: Final Power BI dashboard that combines Streaming and Direct Query tiles |
7. Scenario Analysis and Conclusions
Considering this experience developing a solution with Azure and Power BI for a Real Time BI platform, we have identified the following benefits, as well as areas for future improvement: Advantageous features:
| • | Setting up the Azure services for real-time data queueing and processing is very simple. |
| • | Scaling out the Azure services when we need more resources is just a matter of a few clicks and is completely transparent for the developer. |
| • | The integration between Azure and Power BI is very powerful. |
| • | The Real Time Data Tiles of Power BI Cloud, especially their automatic refreshing, is something that can differentiate the product from its competitors. |
| • | Using Direct Query data sources, we can complement the real-time dashboard with near real-time data. |
Areas for improvement:
| • | In a BI environment, events will mainly be generated in transactional systems, so a continuous monitoring is required, which involves custom developments for each scenario. |
| • | The network latency of the Azure service imposes a limit on the number of events that can be sent per second. We can packetize multiple events to increase the throughput, but there might be a bottleneck. |
| • | Real Time Data Tiles in Power BI seem to be at an early stage of development and they are almost non-customizable. |
| • | Cache refreshing for Direct Query sources in Power BI is limited to 15 minutes, which might be not enough in some scenarios. |
| • | Even though starting the Event Hub and Stream Analytics services is rather fast and easy, it can take up to one hour until we start seeing the real-time tiles showing data and being refreshed. However, once the real-time tiles start showing data they are stable. |
| • | The SQL Database service of Azure gets unresponsive sometimes and requires manual intervention to fix it (restarting, truncating, etc.). The current information provided by Azure is not clear enough to help in finding why the service gets unresponsive. |
Click here if you would like to receive more information about the Real Time BI Services we offer!
Authors: Iñigo Hernáez, Oscar Martinez

