22 Jul 2019 Qlik Sense Custom Themes
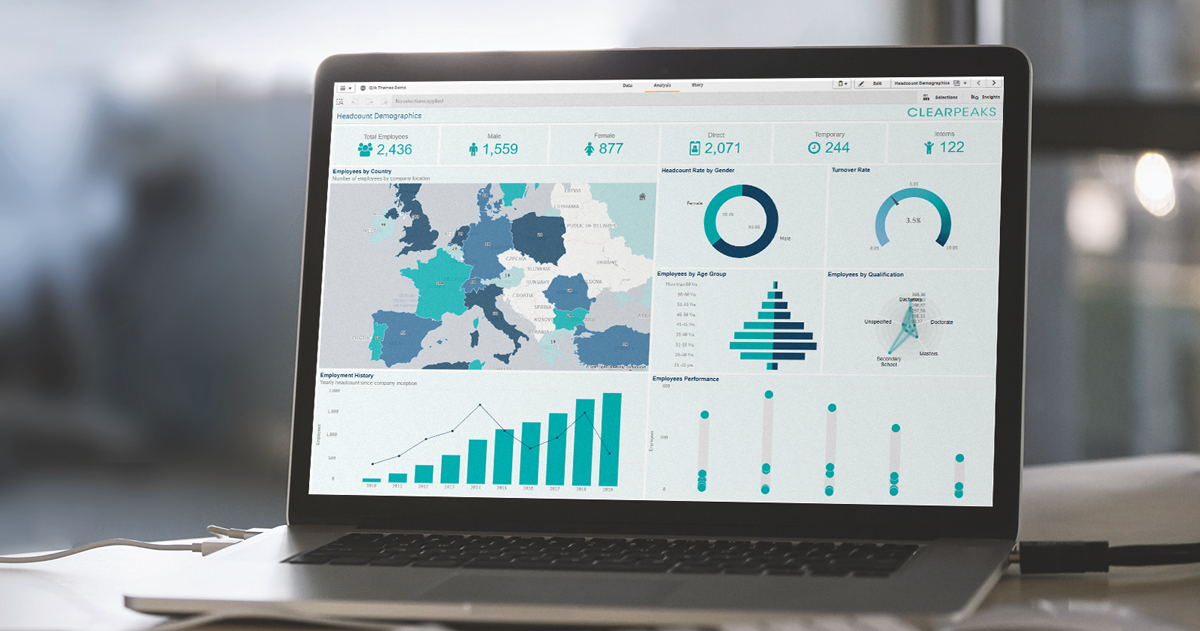
One of the features most demanded by our clients is the ability to adapt the appearance of their dashboards to the look and feel of the company, respecting corporate guidelines and increasing user engagement. In this article we will see how to do this in a few easy steps, using Qlik Sense custom themes.
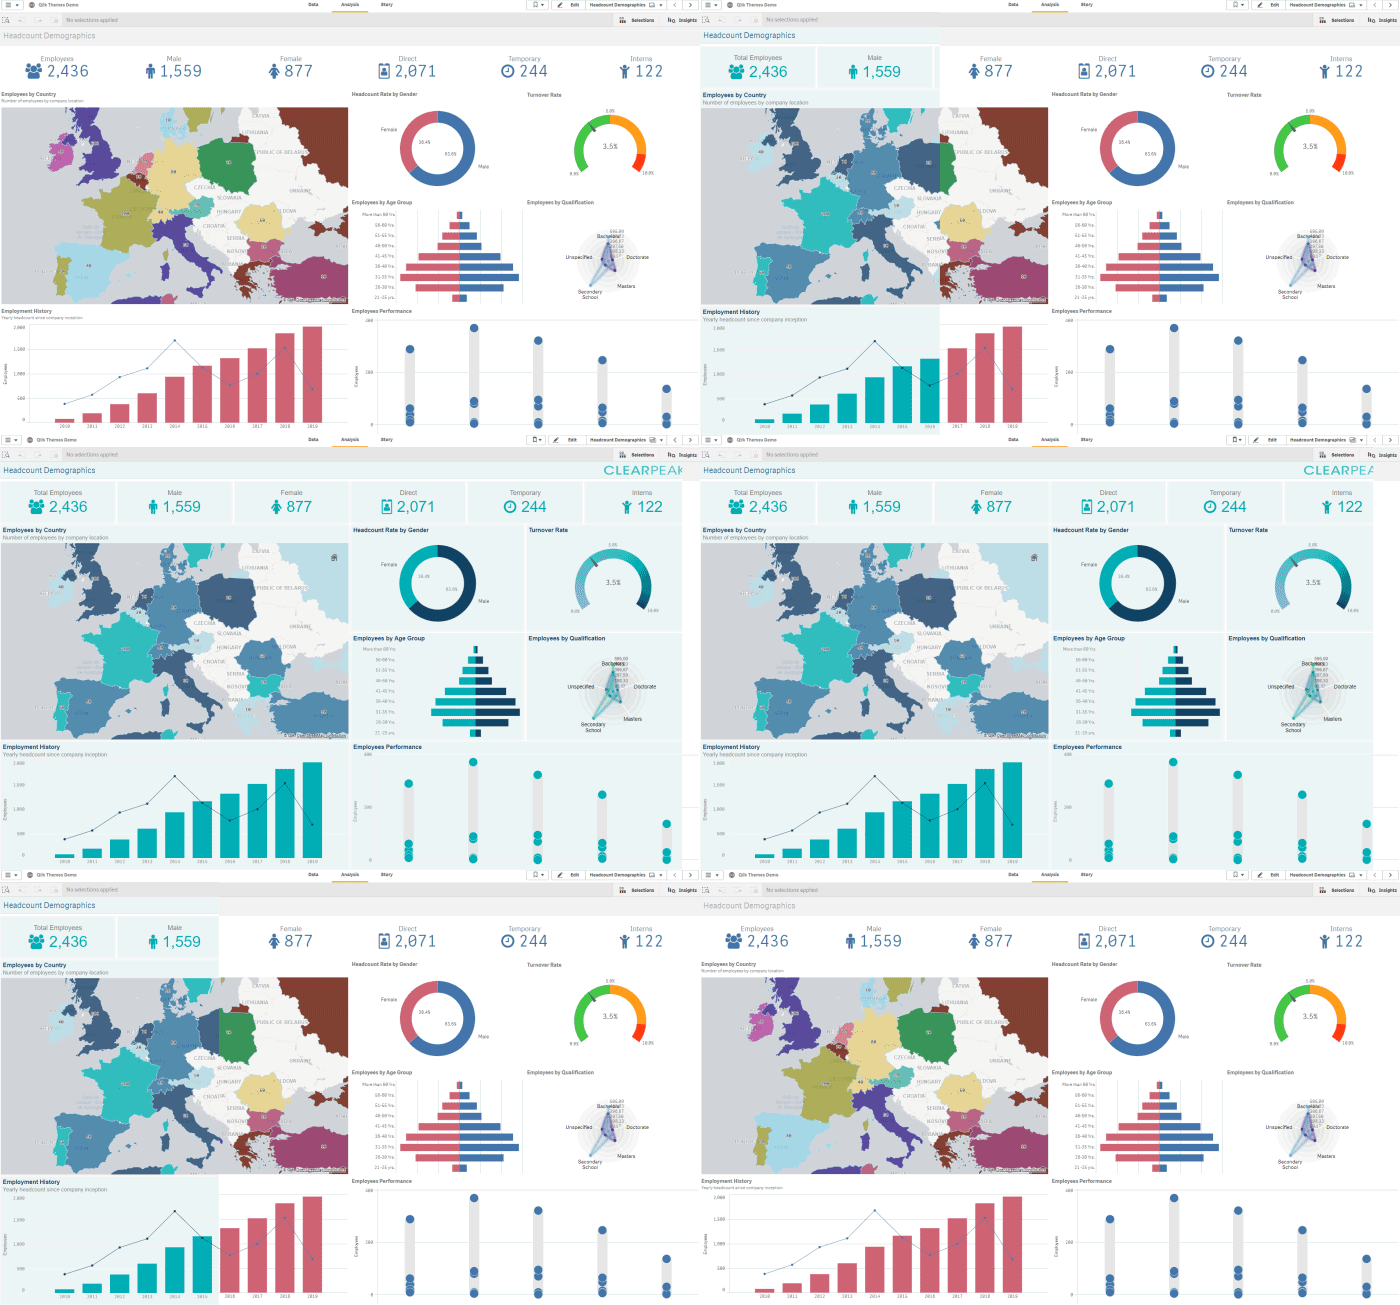
Figure 1: App View (Before & After)
1. Create your own Qlik Sense custom theme
The Qlik Sense themes are composed of the 3 files described below; you can use our files as a base to set up your own.
Figure 2: Qlik Sense theme files
1.1. The definition file (clearpeaks.qext)
The definition file is a JSON that contains the essential properties of the Qlik Sense theme. It is very important that the type is set to “theme”, otherwise Qlik Sense will only recognize it as an extension.
{
  "name": "ClearPeaks",
  "description": "ClearPeaks Corporate Theme",
  "type": "theme",
  "version": "1.0.0",
  "author": "Victor Jimenez"
}
1.2. The main JSON file (theme.json)
The main JSON lets you define all the styles for each visualization type. In the example below, you can find a wide set of variables, and we recommend looking at the Custom theme JSON properties page to see all the available properties.
{
  "_inherit": true,
  "_variables": {
    "@TitleSize": "16px",
    "@SubtitleSize": "15px",
    "@TextSize": "12px",
    "@FooterSize": "10px",
    "@TitleColor": "#154565",
    "@SubtitleColor": "#888888",
    "@TextColor": "#888888",
    "@FooterColor": "#888888",
    "@BackgroundColor": "#ecf5f5",
    "@AxisMajorColor": "#ffffff",
    "@AxisMinorColor": "#ffffff"
  },
  "customStyles": [
    {
      "cssRef": "theme.css",
      "classRef": "sense-theme"
    }
  ],
  "color": "@TextColor",
  "fontSize": "@TextSize",
  "backgroundColor": "@BackgroundColor",
  "dataColors": {
    "primaryColor": "#00afb1",
    "othersColor": "#154565",
    "errorColor": "#CC4000",
    "nullColor": "#CCCCCC"
  },
  "object": {
    "title": {
      "main": {
        "color": "@TitleColor",
        "fontSize": "@TitleSize"
      },
      "subTitle": {
        "color": "@SubtitleColor",
        "fontSize": "@SubtitleSize"
      },
      "footer": {
        "color": "@FooterColor",
        "fontSize": "@FooterSize",
        "backgroundColor": "#ffffff"
      }
    },
    "label": {
      "name": {
        "color": "@TextColor",
        "fontSize": "@TextSize"
      },
      "value": {
        "color": "@TextColor",
        "fontSize": "@TextSize"
      }
    },
    "axis": {
      "title": {
        "color": "@TextColor",
        "fontSize": "@TextSize"
      },
      "label": {
        "name": {
          "color": "@TextColor",
          "fontSize": "@TextSize"
        }
      },
      "line": {
        "major": {
          "color": "@AxisMajorColor"
        },
        "minor": {
          "color": "@AxisMinorColor"
        }
      }
    },
    "grid": {
      "line": {
        "highContrast": {
          "color": "#eeeeee"
        },
        "major": {
          "color": "#eeeeee"
        },
        "minor": {
          "color": "#eeeeee"
        }
      }
    },
    "referenceLine": {
      "label": {
        "name": {
          "color": "@TextColor",
          "fontSize": "@TextSize"
        }
      },
      "outOfBounds": {
        "color": "@TextColor",
        "backgroundColor": "#ffffff",
        "fontSize": "@TextSize"
      }
    },
    "legend": {
      "title": {
        "color": "@TextColor",
        "fontSize": "@TextSize"
      },
      "label": {
        "color": "@TextColor",
        "fontSize": "@TextSize"
      }
    }
  },
  "palettes": {
    "data": [
      {
        "name": "ClearPeaks Palette",
        "translation": "New dimension colors description",
        "propertyValue": "4n7tav",
        "type": "row",
        "scale": [
          "#154464",
          "#00AFB1",
          "#2F6E9A",
          "#B0D9DB"
        ]
      }
    ],
    "ui": []
  },
  "scales": [
    {
      "name": "New measure colors",
      "translation": "New measure colors description",
      "type": "class",
      "propertyValue": "kaqsrg",
      "scale": [
        "#00afb1",
        "#154464",
        "#2F6E9A"
      ]
    }
  ]
}
1.3. CSS file (theme.css)
The CSS file lets you finish off the tuning that could not be done with the main JSON file by modifying the Cascading Style Sheets of the page in runtime.
.qvt-sheet {
	background: #ffffff !important;
}

.qv-object * {
    font-family: arial;
}

.sheet-grid .qv-gridcell {
    border: 1px solid #EEEEEE;
 }


.qv-panel-sheet .sheet-title-container {
    padding-top: 5px;
    padding-bottom: 5px;
    height: 36px;
    /*width: 80%;*/
}

#sheet-title.sheet-grid:after{
	content: " ";
    display: block;
    height: 25px;
    width: 20%;
    background-image: url(https://[qlik-server-address]/appcontent/8cd52dc7-3b4d-4037-8be9-a850e35ce78f/CP_logo.png);
    background-repeat: no-repeat;
    background-size: contain;
    background-position: right;
    margin-right: 10px;
}

/* Chart Headers */
.qv-object .qv-object-header {
    padding-top: 5px;
    padding-bottom: 5px;
    padding-left: 5px;
}
2. Upload the theme to the Qlik Sense server
2.1. Zip the 3 files into one folder
Figure 3: Download ClearPeaks Theme Zip File
2.2. Import them through QMC
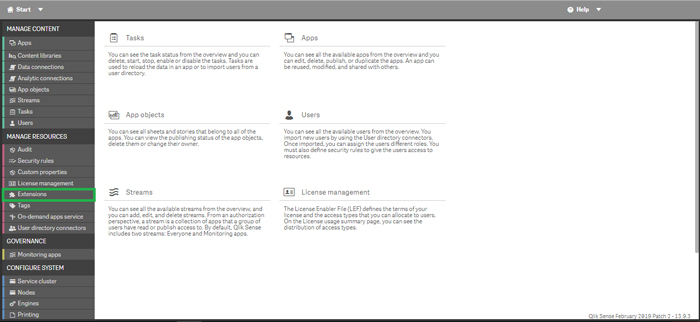
2.2.1. Go to Qlik QMC -> Extensions
Figure 4: QMC Home Page
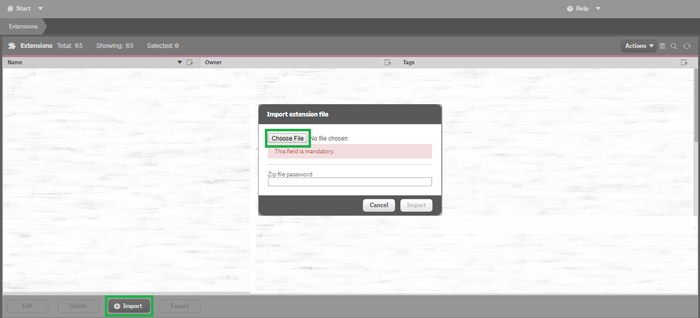
2.2.2. Click +Import and chose the Zip file that contains the 3 files:
Figure 5: Insert Extensions Dialog
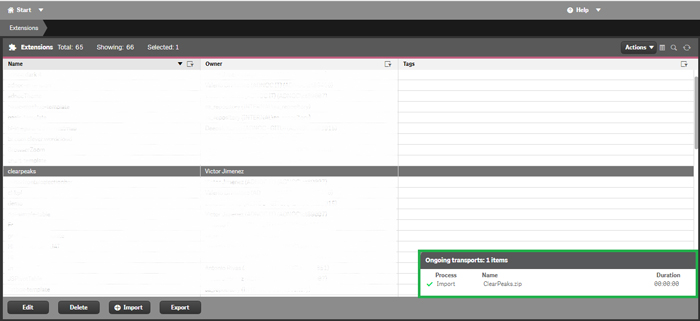
2.2.3. Verify that it is loaded correctly:
Figure 6: Import Successful Message
3. Apply the theme to your dashboard
3.1. Open the App and click on Settings button -> Settings wheel
Figure 7: App Settings Page
3.2. Select theme from the App Theme dropdown
Figure 8: App Theme Dropdown
4. Bonus Track
Use the following steps to get an even more appealing result:
4.1. Use CSS to refile details
The code below improves the title of the sheets and charts by adding padding and setting a fixed height to the sheet title; to be set into the CSS file.
/* Sheet Titles */
.qv-panel-sheet .sheet-title-container {
    padding-top: 5px;
    padding-bottom: 5px;
    height: 36px;
}

/* Chart Titles */
.qv-object .qv-object-header {
    padding-top: 5px;
    padding-bottom: 5px;
    padding-left: 5px;
}
4.2. Modify Font Styles
The code below will change the Qlik Sense default font for Arial on all the visualizations; to be set into the CSS file.
.qv-object * {
    font-family: arial;
}
4.3. Add Corporate Logo
In order to add the corporate logo, we first need to load it into our server; if you don’t have permission to access your server file system, it can be loaded through the front end.
4.3.1. Load the logo into the server:
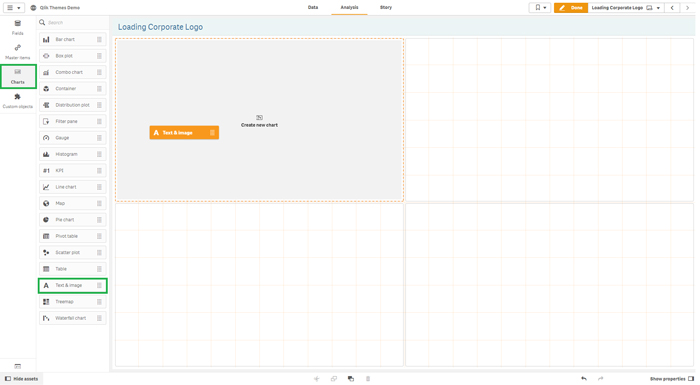
Figure 9: Adding a Text and Image Visualization
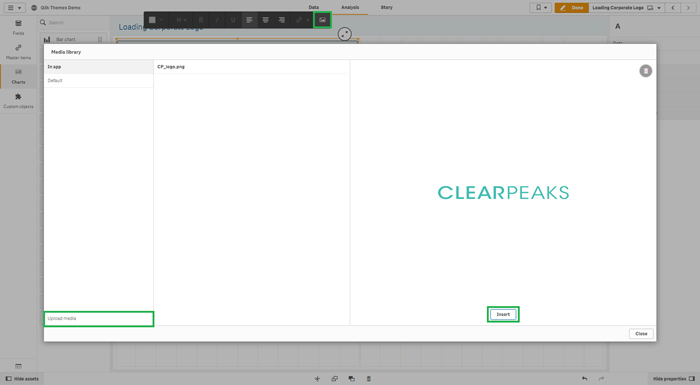
Figure 10: Selecting the logo from your local file system
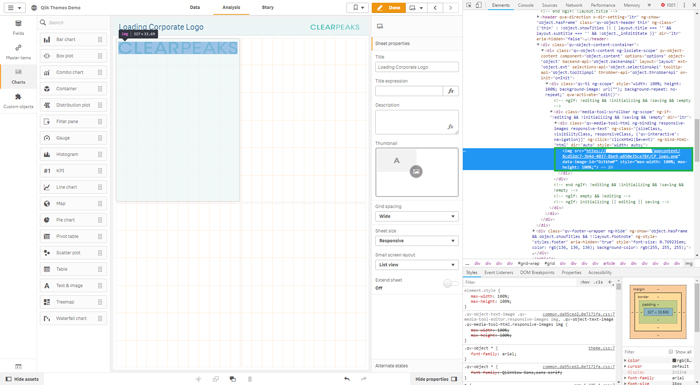
Figure 11: Obtaining the unique ID of the logo
4.3.2. Insert the logo through CSS
The :after property lets you create the logo section in runtime by referring the unique ID obtained above. The following code places it on top right of your page:
#sheet-title.sheet-grid:after{
    content: " ";
    display: block;
    height: 25px;
    width: 20%;
    background-image: url(https://[qlik-server-address]/appcontent/8cd52dc7-3b4d-4037-8be9-a850e35ce78f/CP_logo.png);
    background-repeat: no-repeat;
    background-size: contain;
    background-position: right;
    margin-right: 10px;
}
4.4. Create a Color Palette
"palettes": {
    "data": [
      {
        "name": "ClearPeaks Palette",
        "translation": " ClearPeaks Palette",
        "propertyValue": "3b7caa",
        "type": "row",
        "scale": [
          "#154464",
          "#00AFB1",
          "#2F6E9A",
          "#B0D9DB"
        ]
      }
    ],
    "ui": []
  }
Conclusion
In this article we have seen how easy it is to tune our Qlik Sense dashboards in order to obtain the look and feel you want. If you need help setting up your own Qlik Sense environment or if you just want highly personalized Qlik Sense dashboards, please contact us!

