26 Jan 2021 Power BI: Small Multiples
Creating new visuals with Power BI is usually a fairly simple task. But having to create multiple versions of the same visualisation with different filters is a different story and can make the job a bit more tedious.
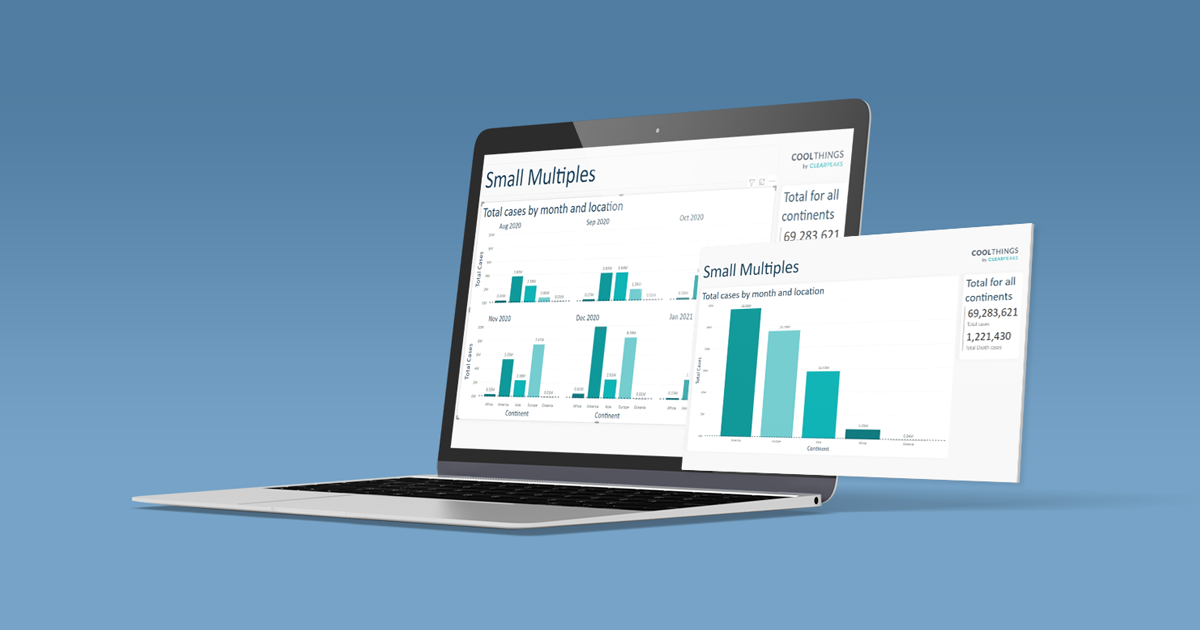
The Small Multiples feature in Power BI allows you to divide the visual into smaller ones by choosing a dimension.
1. Small Multiples in Power BI:
Small Multiples is a new feature added to Power BI in the December 2020 update. It allows you to create smaller versions of a visual by adding a category to it. It is available for bar, column, line, and area charts.
Since it is still a preview, you must first activate it to be able to use it:
File > Options and Settings > Options > Preview features > Small Multiple
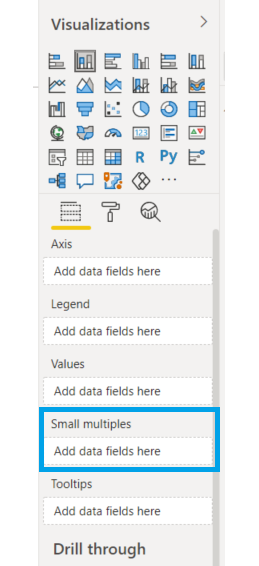
The feature will appear in the Visualization pane > Fields for each of the previously mentioned visuals:
Figure 1: Power BI Small Multiples feature.
1.1. How to use Small Multiples:
In this POC we are working with Covid-19 data from the EU Open Portal Data.
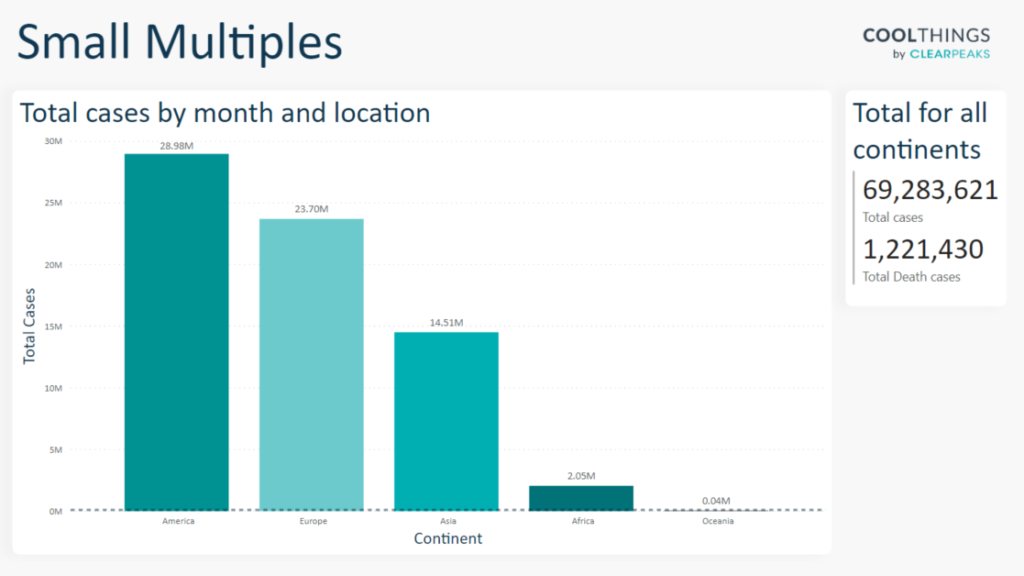
We will start by creating a stacked column chart and a multi-row card. The column chart will show the number of cases per continent between September 2020 and January 2020; and the card will present the total number of cases and deaths in that same period.
Figure 2: Column chart and multi-row card.
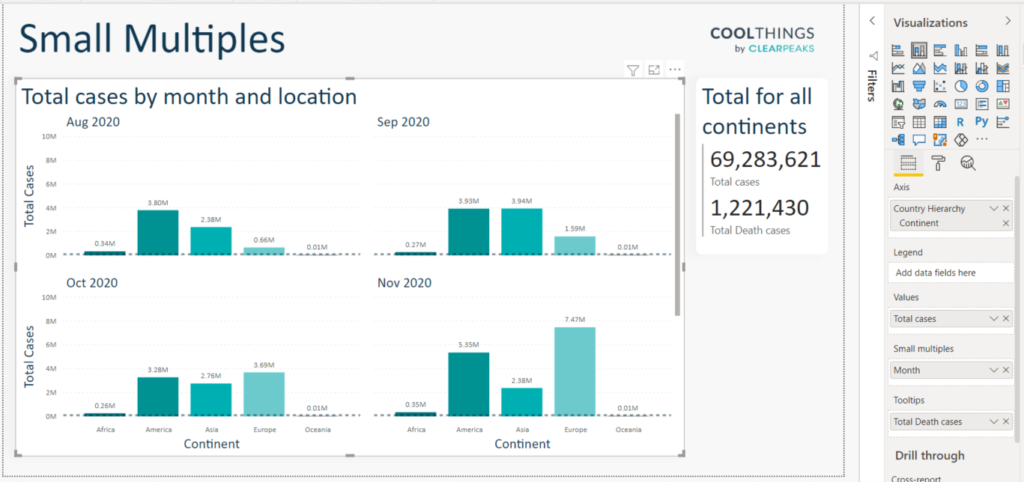
Since we want more detail about this data and know what happened each month, we can add the category Month to the Small Multiples feature. This will split the column chart into a 2×2 grid, where the data is divided into the different filtered months.
Figure 3: Power BI Small Multiples by default.
By scrolling down, we can see the rest of the months.
1.2. Formatting the Small Multiples Visual:
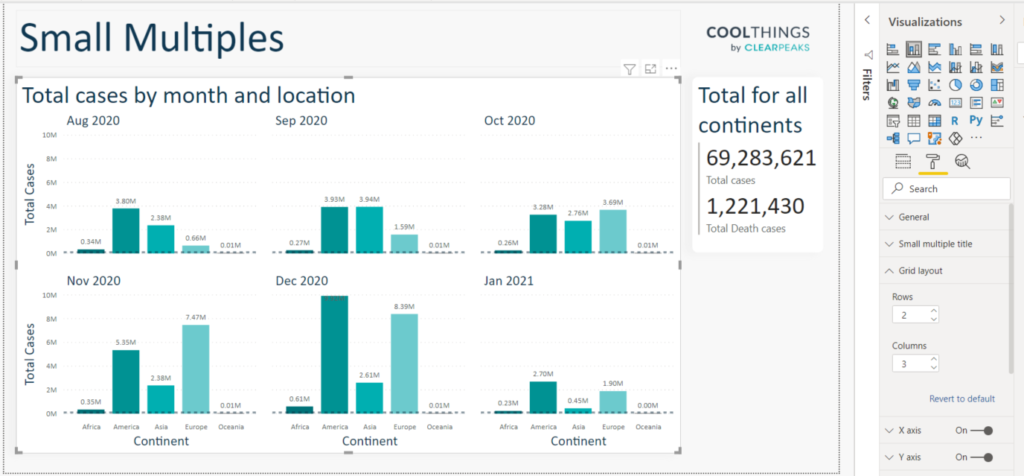
Formatting the Small Multiples visual can be very useful. By modifying the 2×2 grid, we will be able to show all the months at once. To do so, we have to follow this path:
Select Small Multiples visual > Format > Grid layout
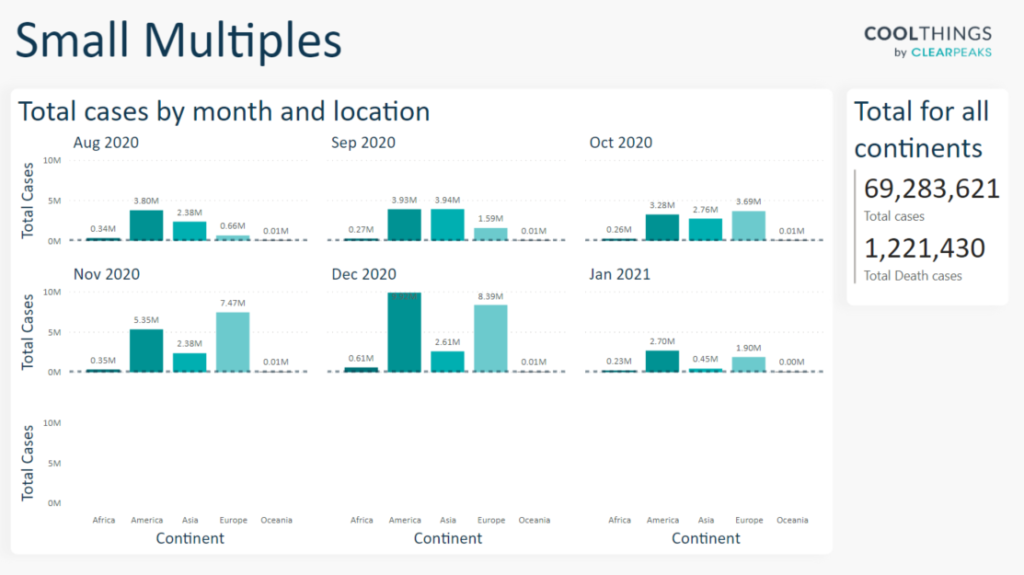
In this case, we will add another column, creating a 2×3 grid.
Figure 4: Power BI Small Multiples formatting.
In case we have more multiples than categories, it will appear with no data.
Figure 5: Power BI Small Multiples category number exceeded.
1.3. Selecting Parts of the Small Multiples Visual:
Selecting different parts of the visual will generate different outcomes:
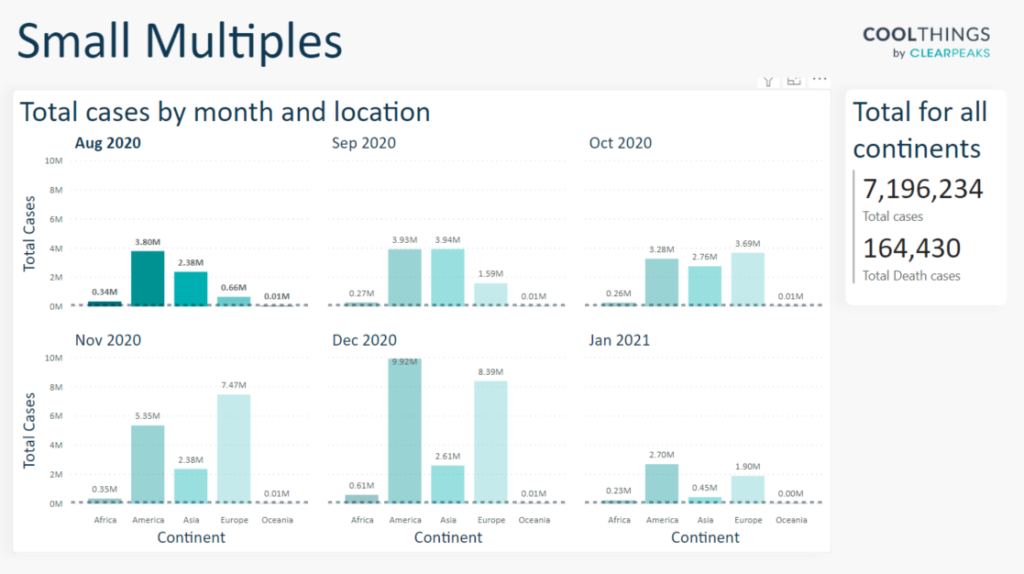
Multiple title. It will highlight and filter the data in that multiple. When we select Aug 2020 in the visual, the multiple is highlighted and the total cases in the multi-row card change to display values for that month.
Figure 6: Small Multiples title category selected.
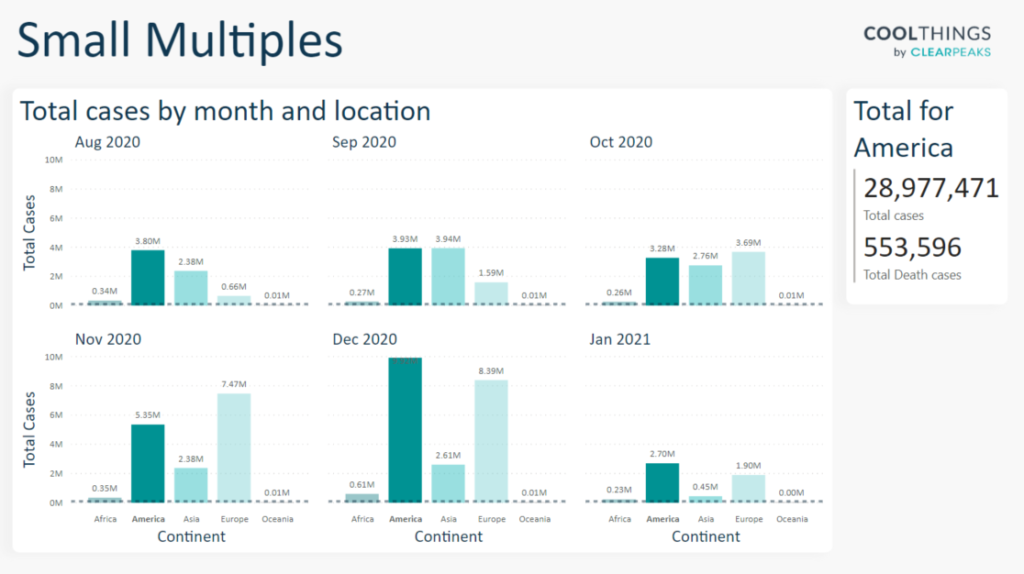
Axis values. It will highlight and filter the data for that given axis value. By clicking on America in any of the given axis values, all the values for America will be highlighted, and the multi-row cards will show the data for America.
Figure 7: Small Multiples axis value selected.
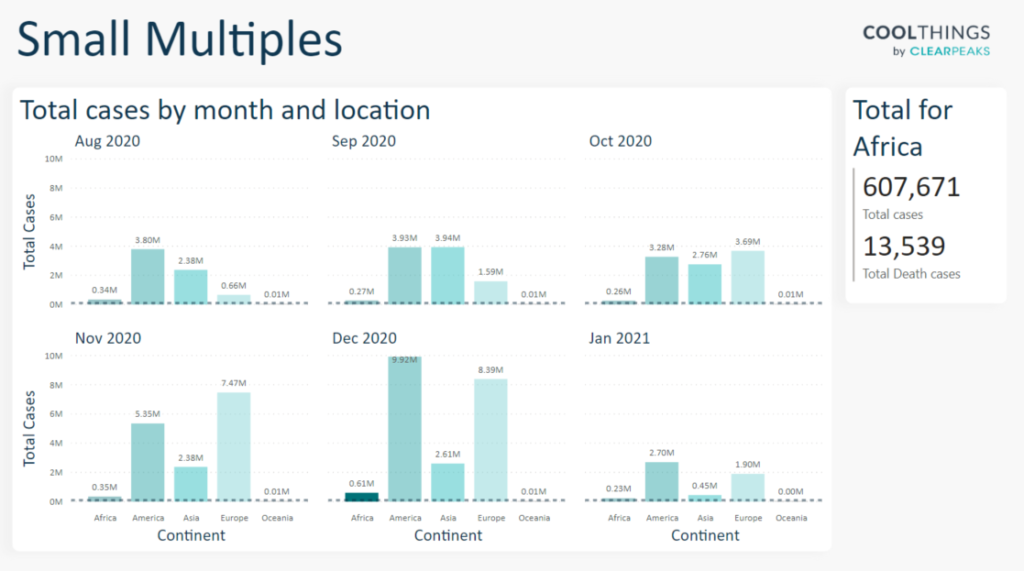
Data points. It will highlight and filter the data for that given data point. When we select Africa Dec 2020, it will highlight all the relevant values, and the multi-row card will show the data for that given month for Africa.
Figure 8: Small Multiples data point selected.
1.4. Limitations of Small Multiples in Power BI:
Sort Small Multiples by measure. This functionality does not exist yet. You can only sort your multiples by the axis and the Small Multiple category natural order.
Trend lines and forecasting. These are disabled for now.
Formatting. There are a few formatting limitations that would give a better understanding of the visual if we had them. These include adding and formatting grid lines between multiples, adjusting their padding, adding colors to the background, and changing or repeating the X and Y axis for each multiple.
Conclusion
Small Multiples is a very useful feature that allows you create smaller visuals by selecting a category, helping you avoid copying and pasting the same visual multiple times. Not only that, you can create different scenarios by selecting the data point, category or multiple title in the visual.
Once the limitations are overcome and the Small Multiples feature is further developed, it will allow for a deeper analysis by sorting measures or adding predictive features such as trend lines or forecasting.
If you are interested in smart narratives that satisfy your BI needs, contact us and we will give you a helping hand!

