12 Sep 2016 Oracle Essbase End-user Tools
Turn around your Excel tables with the SmartView plug-in and discover further insights with Tableau
Excel is the most widespread tool across organizations for dealing with data, and whilst it is clear that it puts a big package of features and capabilities in the users’ hands, it is also worth noting that there are more options to enhance its performance and capabilities. In this Oracle Essbase End-user Tools article, we’ll explore how Essbase and its specific add-in for Excel can bring the performance of your staff to another level when a support tool for data-driven decision making or data analysis is required. Not only we will present the Excel add-in for Essbase, but we will also introduce Tableau as a complementary tool to analyze data from Essbase, thanks to its built-in connector.
1. Main Motivation
Excel is the world’s favourite data analysis tool, but we all too often see how a BI solution with a particular tool is then exported top Excel so that business users can carry on working in a comfortable environment. Instead of trying to fight the end-users’ natural instincts, setting Excel against the BI system, a more suitable approach would perhaps be the following: Why shouldn’t the BI system use Excel as its final consumption tool? You might think that a regular Excel sheet is not fancy or powerful enough to meet the requirements of a BI report tool, but suppose that the BI system is going to use an enhanced version of Excel, specifically designed to gain crucial capabilities in two main aspects:
• Lightning-fast access to corporate data
• User interactivity with data. Drill-downs, drill-throughs, and other capabilities to explore and navigate the data
2. Essbase Technical Overview
Before starting a more detailed description of how Essbase could enhance your BI stack, let’s review what Essbase actually is from a technical perspective. Essbase is as an On-Line Analytic Processing (OLAP) technology which consists of a Multidimensional Database Management System (MDBMS) for storing and analyzing data using a multidimensional approach. This key technologic feature gives us the developed Essbase applications, called cubes (or hypercubes). In contrast with On-Line Transaction Processing (OLTP), OLAP is focused and optimized for processing queries instead of transactions. It is also interesting to mention the etymology of the product name: Essbase stands for Spread Sheet Database, so it’s easy enough to see that it can be optimized for analyzing Excel-like data and enhancing Microsoft Excel for analytic purposes. In particular, Essbase shines at financial reporting, scenario analysis (such as actual, budget, forecast, etc.) and, in general, at analyzing highly hierarchical data and complex formula calculations.
3. Benefits and enhancements of empowering Excel with Essbase
So far, we have introduced Essbase as a tool that could empower Excel in order to provide an enhanced experience to Business users working with data in spread sheets, and we have also outlined the technology behind it. But what exactly are the specific features and capabilities that this OLAP system can really offer Excel? Let’s have a look at some of what Essbase can do for Excel users:
• Build your own ad hoc analysis in a user-friendly way. And remember you will still be using your favorite spreadsheet program!
• Navigate the data. Once a cube is accessed from Excel, exploring the data through all its dimensions is both fast (we are talking about sub-second query times) and intuitive. After a quick training session on the new features offered by this tool, users will find themselves slicing and dicing the cube according to the specific information they are looking for.
• Drill-down through the hierarchies of your dimensions. Cube dimensions are designed in a hierarchical fashion in Essbase, and aggregation rules are always defined for its measures. This provides built-in drill-down functionality, allowing the end-user to retrieve data with the best-fitting detail for each analysis.
• Access pre-built reports directly in Excel. Although ad hoc analyses may be the jewel of the crown, SmartView for Excel also provides functionality to develop reports so that they can be directly accessed by end-users.
• No exporting and importing data. There is no need to export the requested data from any BI presentation tool for subsequent import to Excel; the data is already in Excel, and you only need to access the cube, look for the required data and build your own custom analysis. Bear in mind that once the data is in your spreadsheet, no one is going to prevent you from applying formulas to get new calculations to support your analysis.
4. Hands On: SmartView add-in for Excel
Now everything’s ready for show-time! Let’s proceed to a brief demonstration of how to access to your Essbase applications (cubes) with the SmartView plug-in for Excel. Once the add-in (kindly provided by Oracle) is installed in the user’s local machine, the SMART VIEW tab will be available right after the default ones. The very first time, it will be necessary to set up the connection to Essbase. Once this is done, connecting to the server is going to be as easy as:
➜ Open the SMART VIEW table
➜ Click the Panel button
➜ Access Shared Connections
➜ Fill in your user name and password
Figure 1: Applications (cubes) with the SmartView plug-in for Excel
Note that all the security settings for data governance are managed through user accounts in the Oracle’s WebLogic domain. Once logged in, we will be able to select the Oracle® Essbase server, where the developed applications will be shown; expanding the desired application will show the cube deployed. Clicking the cube (in this example we are selecting TBC_PO) will make different options to access and manage it available.
Figure 2: Excel SmartView Shared Connections
In this case, we select Ad hoc analysis, thus loading the cube and making the ESSBASE tab available:
Figure 3: Excel Ad hoc analysis
Here we can see the aggregation of total profit across all the dimensions. We can move dimensions in and out of the spreadsheet, set filters and drill-down to the level of detail required. In this article, we will perform two different ad hoc analyses:
Analysis 1
We want to look at the Sales per region across the year 2000. We will need both Market and Time dimensions:
Figure 4: Analysis 1
Double-clicking the Market dimension will drill-down to the next level of the Market hierarchy:
Figure 5: Analysis 1 – Market hierarchy and Time
In a few steps, we obtain the desired dataset (by drilling-down and pivoting the dimensions):
Figure 6: Analysis 1 – Sales by Market and Time
Analysis 2
Now let’s say that we are interested in the Sales by Product type and quarter, across the year 2000. We will need both Product and Time dimensions. Then, as we did in the other analysis, we will drill-down until we get the desired detail of data. Let’s have a look at the final dataset:
Figure 7: Analysis 2 – Sales by Product and Time
Now that the desired data has been gathered, it is up to the user whether there are going to be further steps in the analysis or not. In any case, the good news is that the data is already in Excel, so it is 100% ready to be played with. As you can see, in a few steps we can build our own ad hoc analyses by querying the Essbase cube, which provides us with fast access to corporate data. And there is no need for the end-user to work in any BI-specific client tool; everything is done in the friendly Excel domain.
5. Hands On: Tableau with Essbase data sources
Now that we have seen the classic end-user tool for accessing Essbase applications, we are going to introduce an alternative, more oriented to data-discovering and visualizations, in a modern-day BI fashion. There are a number of similar tools covering this market, such as QlikView or Microsoft Power BI. In this article we will introduce Tableau, which comes with a pre-built connector for Essbase. In particular, we will show how to perform the same analyses as above with SmartView, but taking advantage of the advanced visualizations to give them a special twist. First of all, we need to make the connection to the cube. In order to do so, we have to:
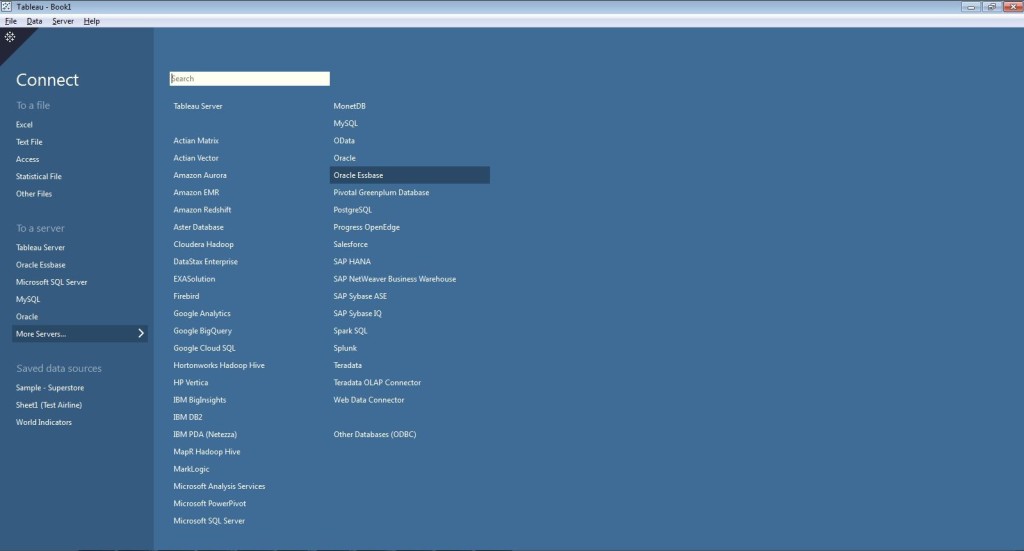
➜ Click More Servers…
➜ Select Oracle Essbase
➜ Fill in the connection properties
Figure 8: Tableau with Essbase data sources connection properties
Figure 9: Oracle Essbase: Connection
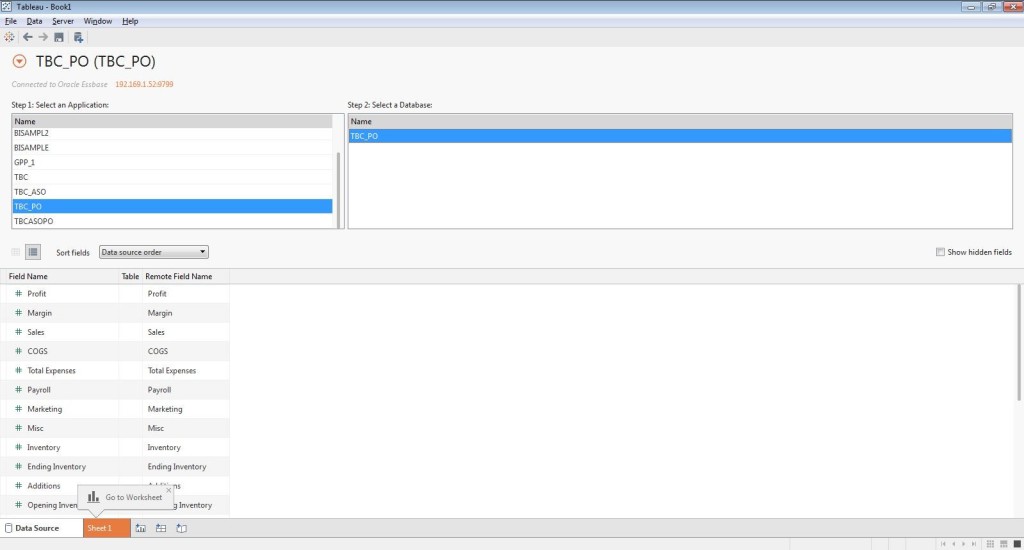
Note that a specific driver is required for this connection; if it is not already installed in the client computer, Tableau will provide a link to download it. Once the connection with the server is set up, we need to select the application and the Database:
Figure 10: Tableau Database
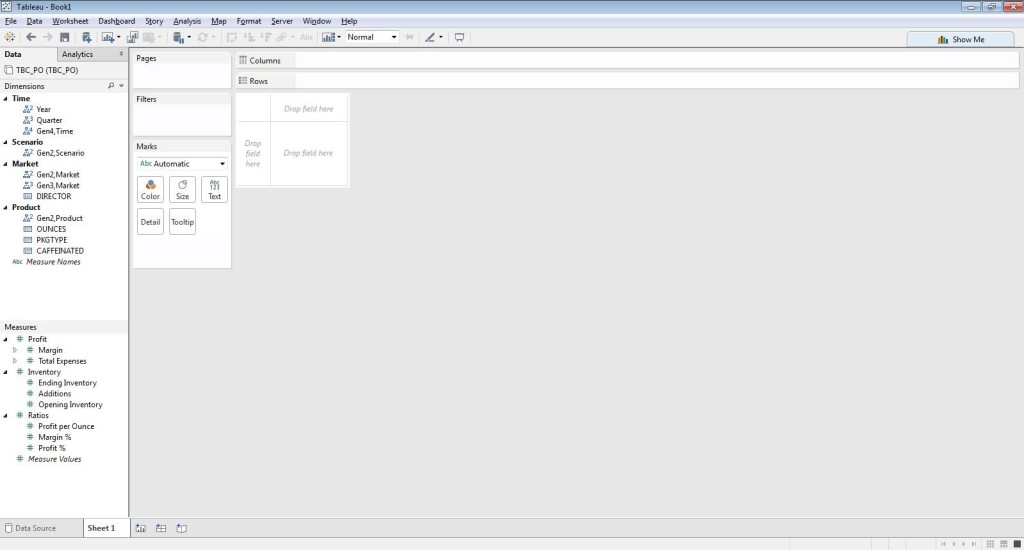
Clicking Sheet 1 will open the default blank sheet for the selected cube. Note that both Dimensions and Measures come with pre-built hierarchies (those we set up in Essbase):
Figure 11: Tableau Clicking Sheet 1
Now we can proceed with the two analyses:
Analysis 1
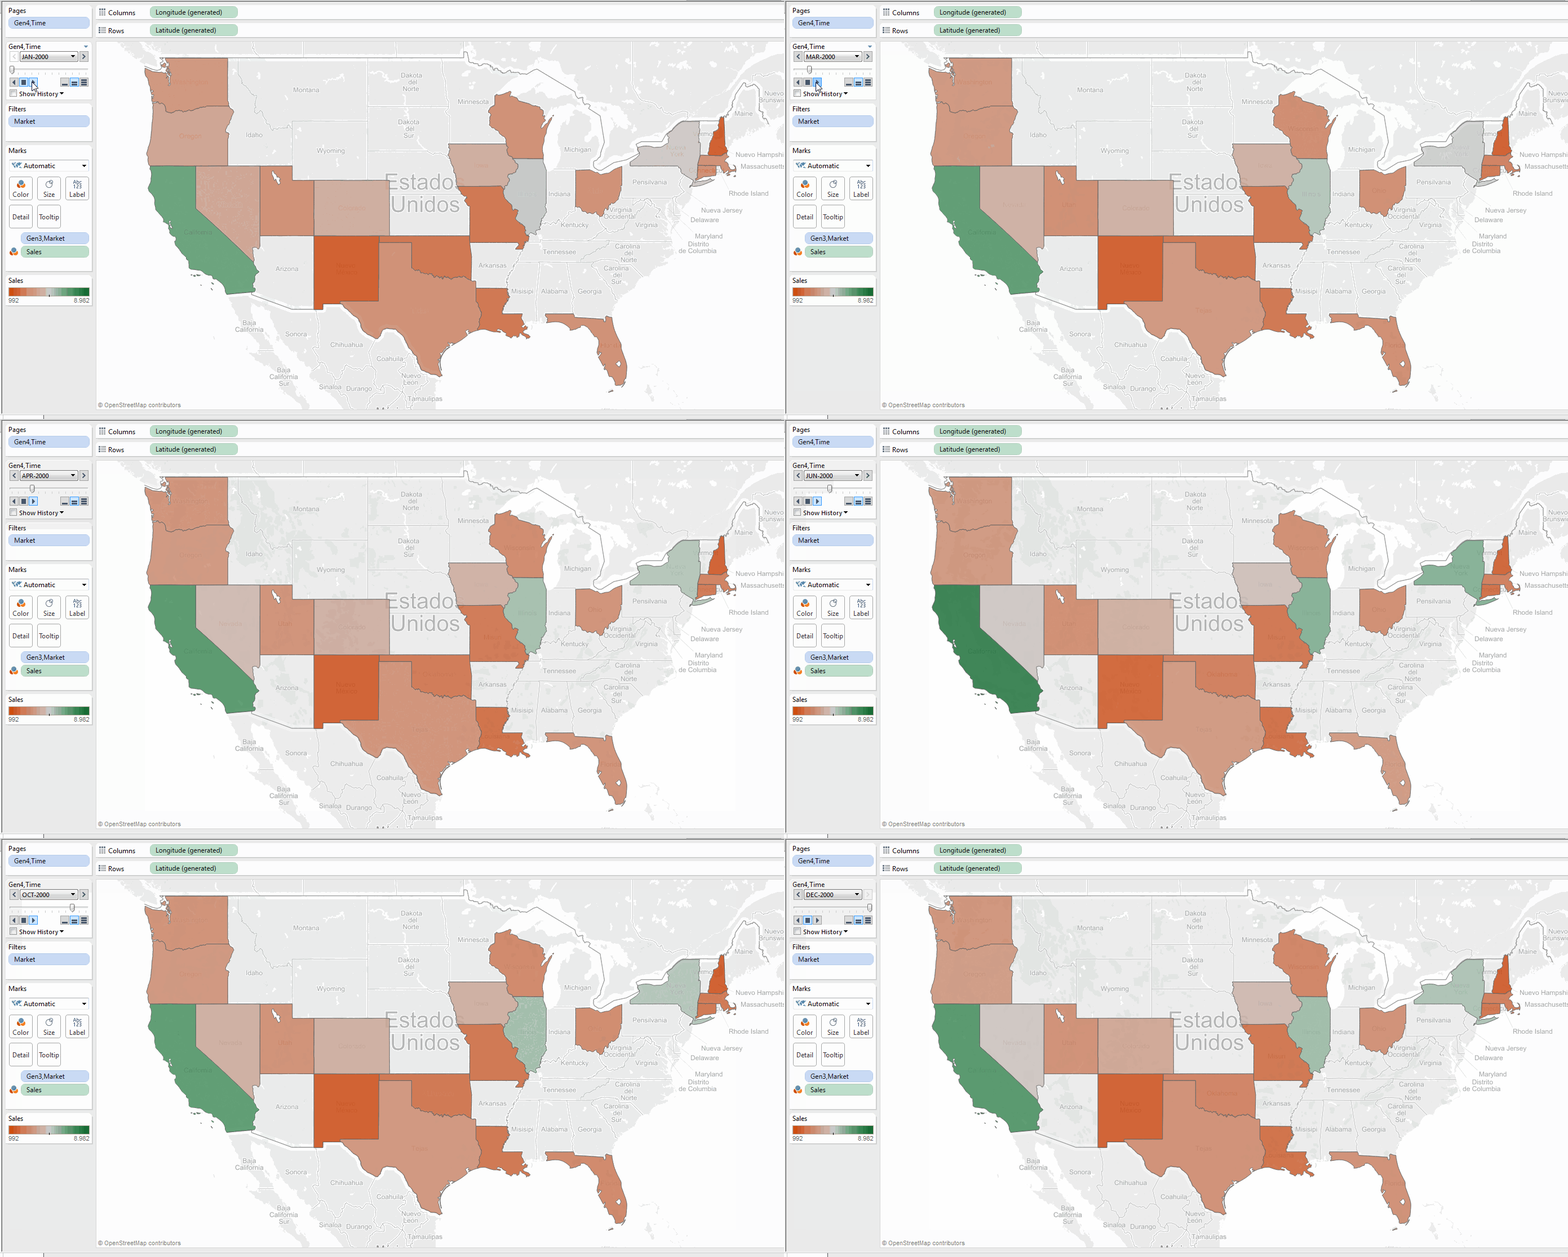
We want to look at the Sales per region across the year 2000. In this case, we can take advantage of Tableau’s map visualization, and also use an animation to represent the Time dimension:
Figure 12: Oracle Essbase: Analysis 1 – Sales per region across the year 2000
It’s a rather different output from before, isn’t it? Of course, there is no good or bad output; it all comes down to each analysis’s requirements. This one is much more useful in a scenario in which we are attempting to gain some extra insight from our data, while in the other, we might be more interested in the specific amount ($) of Sales for each region and month, or perhaps plan to use it as the input data for further calculations.
Analysis 2
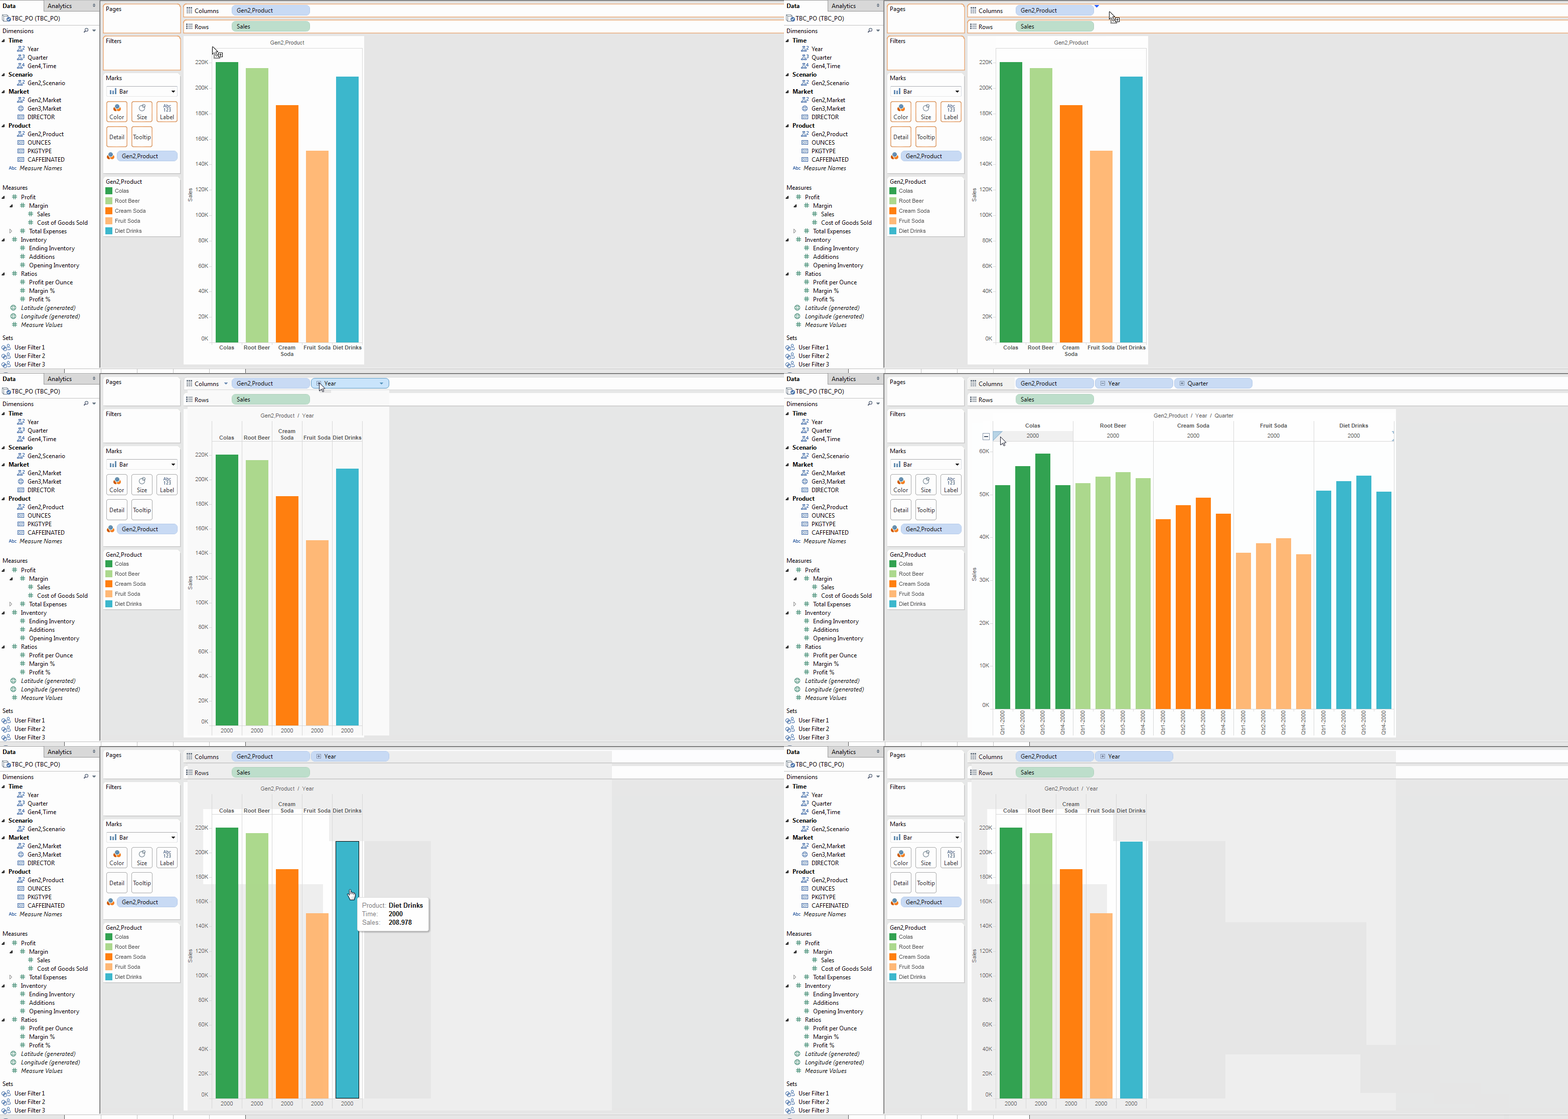
We are interested in the Sales by Product type and quarter, across the year 2000. It is worth noting that we have the functionality to drill-down in the Time dimension, so that we can display the information by quarter instead of by year:
Figure 13: Oracle Essbase: Analysis 2 – Sales by Product type and quarter, across the year 2000
Again, the outputs of an equivalent analysis in Tableau and in SmartView are quite different; nevertheless, we maintain that both tools are complementary, each one better suited to different analytic scenarios. Finally, I would like to provide a (non-exhaustive) summary list of extra features and limitations:
• Extra features – Dynamic hierarchies inherited from the database (no need to build them in Tableau) – Alias file support, in order to display the aliases created in Essbase – Creating Calculated Members for the Measures, through MDX queries to the cube – Security settings and functionality preserved from the Essbase configuration (within Weblogic domain)
• Limitations – Extracts are not allowed, only direct connections to the cube – Drill-down is not available for Measures – It is not possible to create Dimension Calculated fields – It is not possible to create Constraints for Level of Detail Expressions
Conclusion
In this article, we have been looking at how Essbase can empower your spreadsheets and take them to a new level. We have also introduced Tableau as a complementary alternative to SmartView for Excel, which may be better suited to certain analytic situations. So far we have only spoken about end-user applications and how can they be empowered by Essbase, so now let’s have a brief look at some of the generic benefits of using Essbase:
• Centralized and consistent corporate information, with security settings governed by Weblogic server
• Outstanding performance and features for financial analytics
• Built-in writeback capabilities
• Fast, in-memory database. Response query times much lower than RDBMS
It is also worth noting that we have only mentioned a few end-user tools, but these are not the only ones. The different tools can be placed in three main groups:
• Specific tools for Essbase: like SmartView for Office or EAS Console
• Traditional BI tools: like OBIEE, which can have Essbase as one of its data sources
• Modern BI tools more focused on data discovery: like Tableau or QlikView
To summarize, Essbase is a data storage tool that excels in fields where RDBMS can’t match its performance in analytics with highly hierarchical information and complex formula calculations. Besides its core technical features, it performs really well as a database system for spreadsheet data, both because of its design and SmartView client tool. And it’s not only limited to spreadsheets – there are also more data discovery oriented tools, offering built-in connectors. So, if you are looking for a way to enhance your company’s analytics, especially if you want to boost Excel or if you are in a financial environment, Essbase may just be the back-end tool you are looking for!
Click here if you would like to receive more information about the topic!


