29 Apr 2015 Oracle BI Mobile App Designer v2 – Key Features
Introduction
Oracle BI Mobile App Designer (MAD) is the tool integrated on OBIEE 11g to perform analytics on mobile devices, as explained on a previous blog article, this article will extend the Oracle BI Mobile App Designer explaining the new features of the Mobile App Designer V2. This version of bimad comes into the patch 18794832
1. Redesigned UI
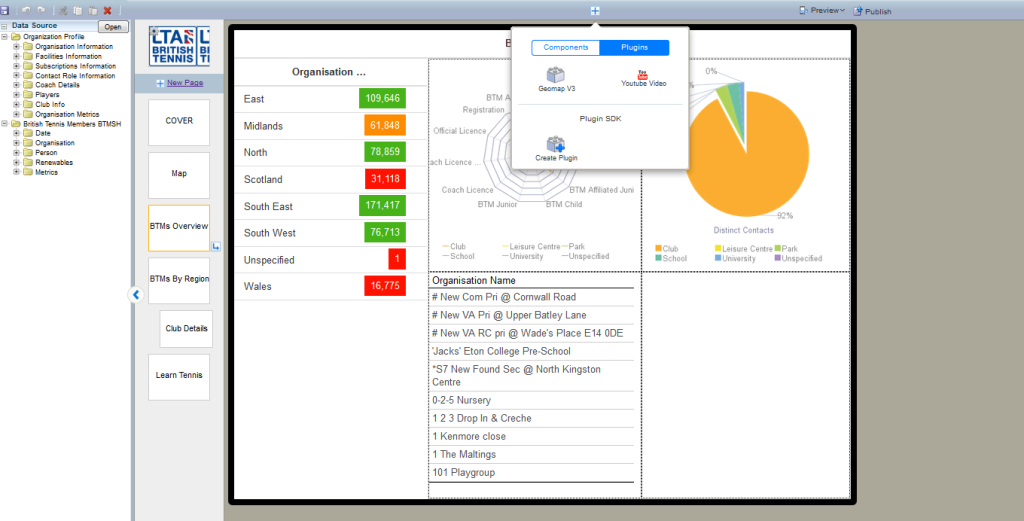
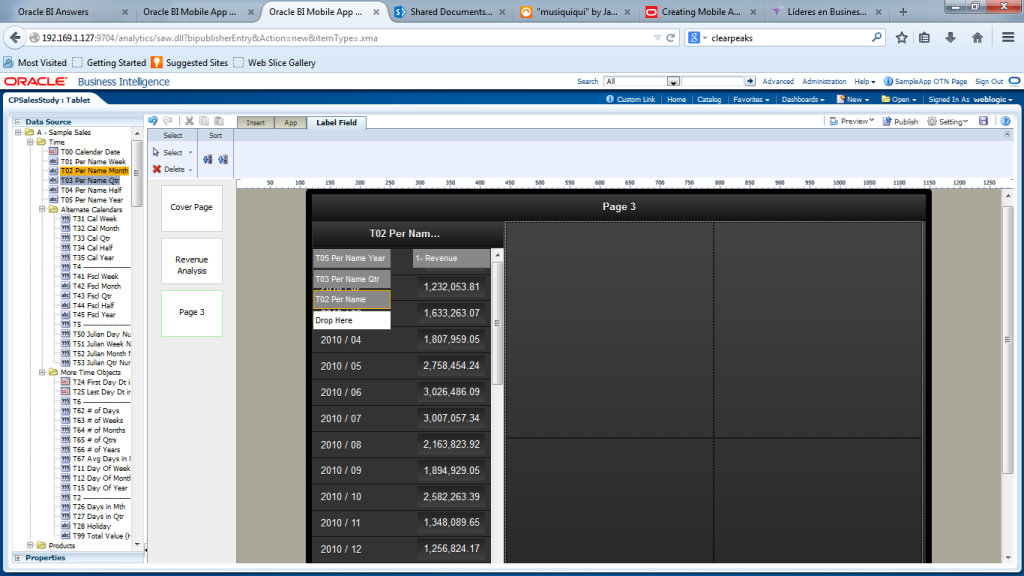
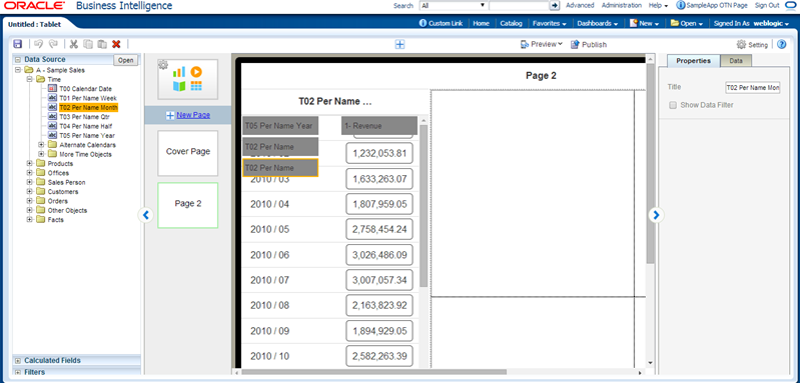
The layout of the tool has completely changed, now we can add components on the pages using the “+” button on the top of the page designer, filters and calculated fields will appear on the left hand side of the window, below the datasources.This new design is much intuitive than the previous one:
2. Exploration Template
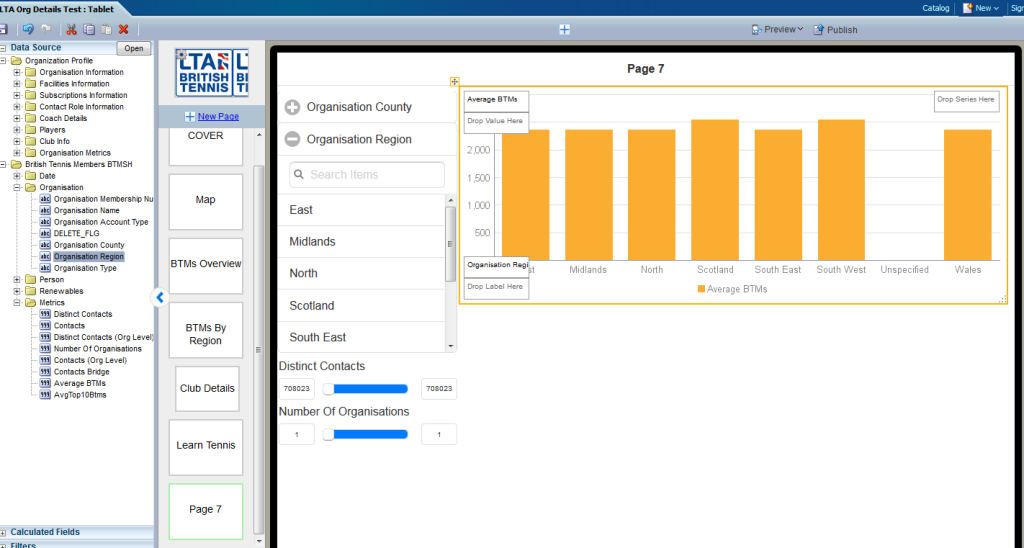
This new page template will allow us to make an exploratory analysis on the data by adding filters on the right hand of the layout, for numerical data, the filter displays as an slidebar, for categorical data, we can choose several values from the list of the available filters
3. New Map Component
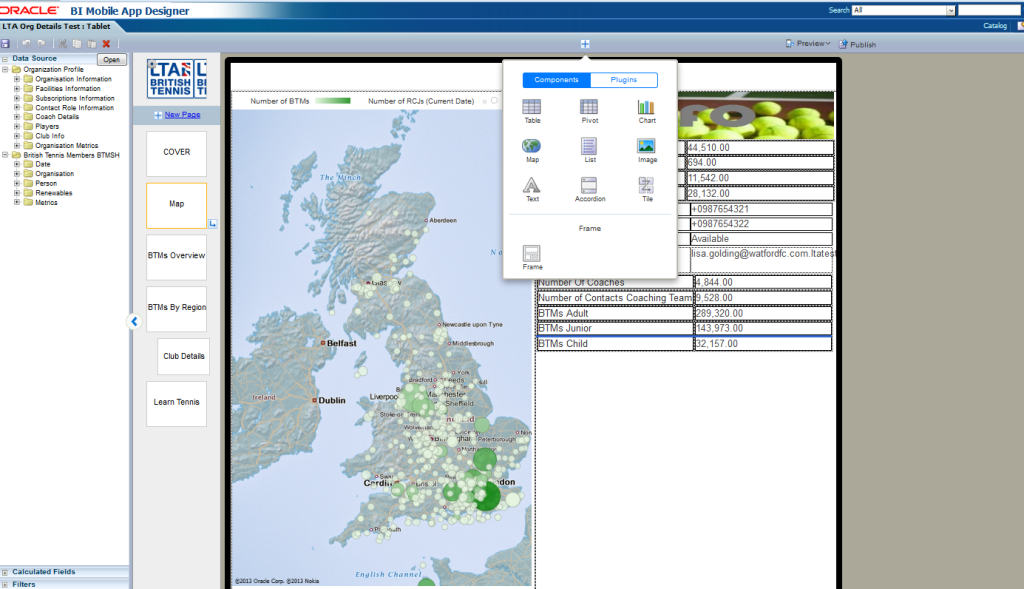
This is probably one of the most useful changes on this version, it comes by default with a map component, so there is no need to code your own plugins to visualize maps, we can choose between region maps and location maps, which allow us to display lat-long coded data:
There are several country maps you can download from the oracle OTN here: http://www.oracle.com/technetwork/middleware/bi-foundation/default-2397753.html
The map component of the first releases of MAD V2 did not have zoom button features on the map, so you may need to download and install the April’15 patch to use it, you will have just to deploy the new .ear file. Can be downloaded here: https://support.oracle.com/epmos/faces/PatchDetail?_afrLoop=280648419500544&patchId=20823740&_afrWindowMode=0&_adf.ctrl-state=qiyeq9qlu_66
4. Calculated Fields and filters
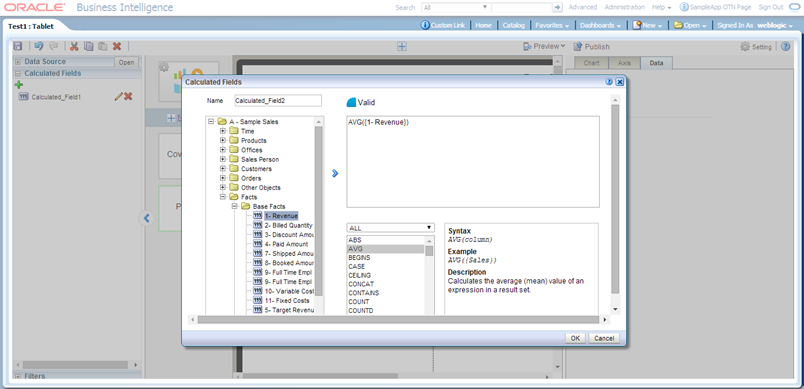
Now we will be able to create calculated fields and filter. Using the Formula editor we can create custom fields, this fields will be available as any other element in the data source.
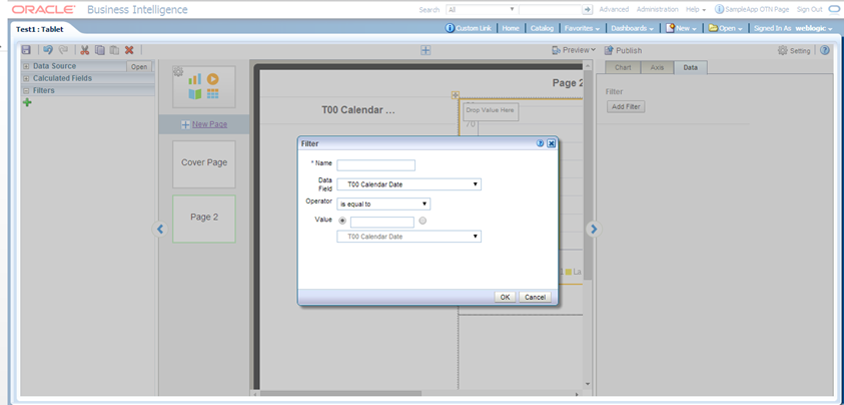
To create a Filter select the filters tab in the right pane and click the + icon, you can the apply this filter to the different charts added into the layout.
These filters can be added to another components on the data tab into the properties of the component
5. Plugin SDK
This new feature allow you to create your custom plugins without the need to have a complete environment. It comes with a test server based on node.js that will help you to develop your own plugins. You can download and follow the guide to install it by clicking on Create plugin and the download bimad.zip. Once coded you can deploy them as in the previous version, pasting them into the /plugins folder of the bipublisher

