04 Mar 2019 New Plugin to navigate from OAC to OBI keeping the filters
As you know, OAC (Oracle Analytics Cloud) is one of the most appreciated cloud tools in the Oracle world. It’s a unique platform solution that empowers users to discover their own data insights.
Just like with other tools, plugins can be added to introduce more functionalities to an application. In this article we’ll explain the process that we went through to create a new plugin that allowed users to decide whether to keep the filters or not when navigating from OAC to OBI.
1. Basic OAC concepts
To see how it works, it’s very important to understand the different types of filters available in OAC. There are 2 different types:
- Filter bar: the filter bar is a global bar placed in the header of the dashboard that contains different filters that apply to the entire canvas without exception.
- Visualization filter: this filter only affects the specific visualization in which it is defined.
Before going into more details on the development, it is also important to know what a data action is, and what its main functionalities are.
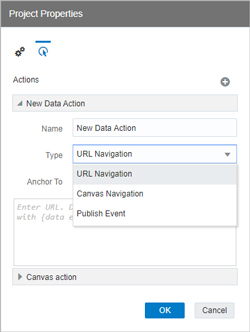
A data action link can pass context values from OAC as parameters to external URLs and filters to other projects or to visualizations embedded in external containers. When you set up a new data action for a specific canvas, there are three different options:
Figure 1: Data Actions – different options.
The first option, URL Navigation, is to create a link to an external dashboard, no matter where it’s placed. In our case, the plugin was built to navigate to a specific target, OBI.
The second option, Canvas Navigation, is to navigate to another canvas inside the same project. This option is beyond the scope of this article, so we’ll say no more about it.
The third option is to embed a visualization in an external container (for example, an HTML page). An embedded data action allows the user to interact with the embedded visualization in the external container. This option is also beyond the scope of this article.
Now that we know how the filters work and how a data action behaves, it’s time to present the solution that we have developed here at ClearPeaks.
2. Our solution
We have built a plugin whose functionality is to detect the current filters of a visualization and keep them when navigating to OBI. The biggest challenge we faced was to understand the way OAC stores the filters in a URL and transforms them to adapt to OBI, so first let’s look at creating a data action in OAC:
- Click on canvas Menu and then on Data Actions.
- Click on Add Action and enter a name for the new navigation link.
- From the list of type options, select URL Navigation.
- Leave Anchor To
- Enter a URL address that starts with https: and includes notation and parameters following the pattern below:
https://www.address.com?<key>{<value>}
Figure 2: Steps to create a Data Action.
In our plugin, the URL points directly to the OBI address, so the OAC URL looks like this:
http://IP:9704/analytics/saw.dll?PortalGo&Action=Navigate&path%2Fusers%2FUSER%2PROJECT_NAME&
P0=1&P1=eq&P2=»Country»&P3={XSA(‘admin’.’Sales’).»Columns».»Country»}
The parts of the URL in bold are the ones that should be customized. The P-method is the way we pass filters through an external link. However, the way we must add the data action link is different from the way OBI would do it – and that’s our plugin functionality, to transform the OAC link to make OBI understand it and keep the existing filters. The OBI URL looks like this, and the parts to fill in are in bold:
http://IP:9704/analytics/saw.dll?PortalGo&Action=Navigate&path=
%2Fusers%2FUSER%2FPROJECT_NAME&P0=1&P1=eq&P2=%22Country%22&P3=%22Spain%22
Another big challenge we needed to deal with when building the plugin was the fact that when we click on a visualization to navigate through a data action, the URL link doesn’t filter the filter bar, but only the visualization filters. As it’s very important to keep them all, we started looking at the JavaScript code that OAC uses to take the current filters, in order to add them in a standard format at the end of the URL.
Furthermore, we needed to check if the filters in the filter bar were repeated in the visualization; if so, we avoid them. The priority filters are those embedded in the visualization followed by the most restrictive, so we simply check if there are any extra filters in the filter bar and if so we add them to the URL.
3. Use case
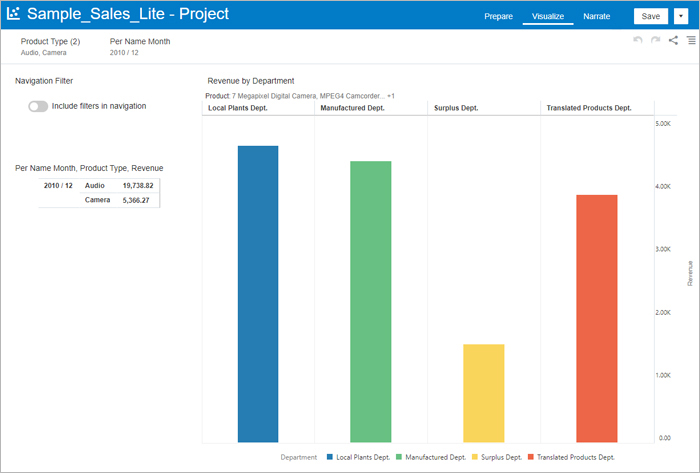
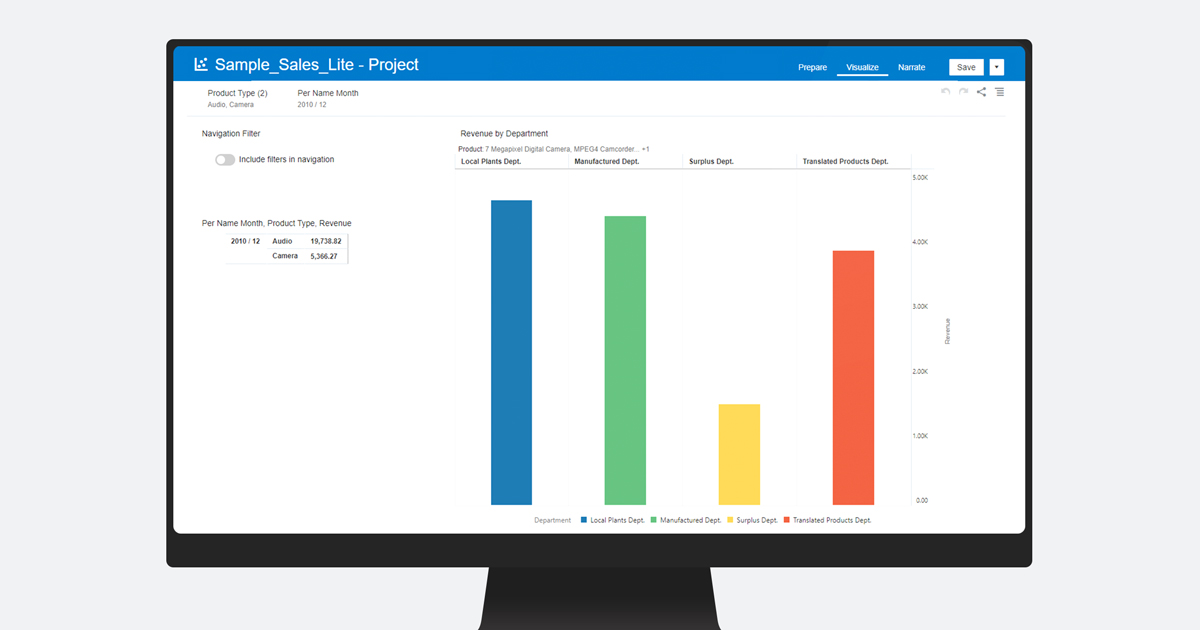
Let’s look at a real-life use case to see how it all works: basically, we have a dashboard in OAC, and we want to travel to an OBI dashboard whilst keeping the OAC filters. We can see our OAC dashboard below:
Figure 3: OAC dashboard.
In this dashboard we are analysing the revenue per product type and department, with the following filters:
Filters tab:
- Product Type in (Audio, Camera)
- Per Name Month = 2010 / 12
Bar chart visualization:
- Product in (7 Megapixel Digital Camera, MPEG4 Camcorder, MicroPod 60Gb)
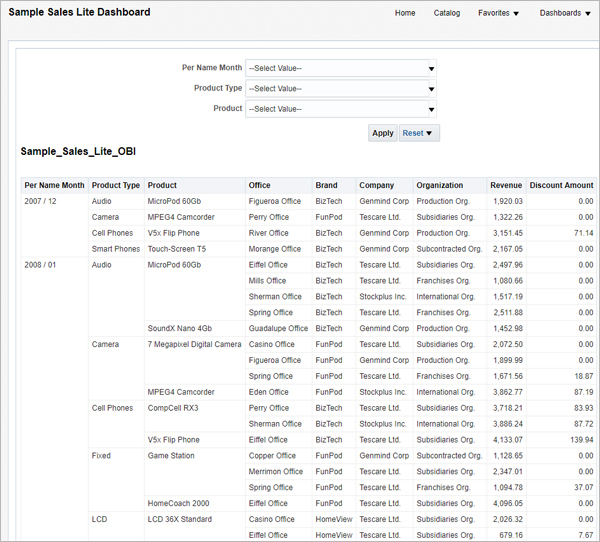
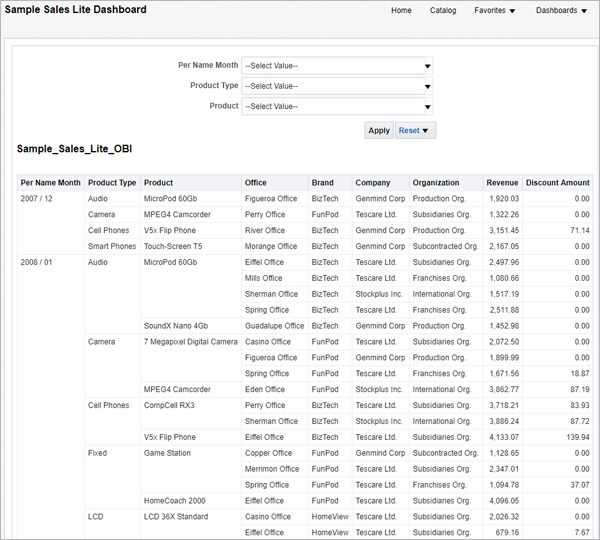
We are also analysing the same parameters in a dashboard in OBI, but without filters and with extra attributes to complement our analysis. As it’s easier to analyse these attributes and metrics in OAC, we would like to slice and dice the data in OAC and pass the filters to OBI to get a higher level of detail. This is the OBI dashboard:
Figure 4: OBI dashboard.
This dashboard contains more than 1,000 rows, so it will be very handy for a user to leverage the data action to filter it.
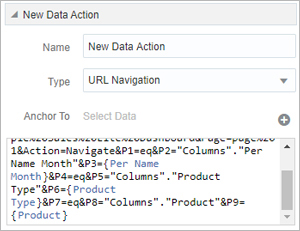
We’re going to test both options: navigation with the plugin toggle button off, and then with it on. First we have to create the data action URL. Our goal is to be able to click on the bar chart and keep not only the filters embedded in the filters tab, but also in the visualization (product). In the end, we’ll be importing 3 different fields: Per Name Month, Product Type and Product:
https://IP/analytics/saw.dll?Dashboard&PortalPath=%2Fusers%2Fadmin%2FSample%20Sales
%20Lite%20Dashboard&Page=page%201&Action=Navigate&P0=3&P1=eq&P2=»Columns».»Per Name Month»&P3=
{XSA(‘admin’.’Sample Sales Lite’).»Columns».»Per Name Month»}&P4=eq&P5=»Columns».»Product Type»
&P6={XSA(‘admin’.’Sample Sales Lite’).»Columns».»Product Type»}&P7=eq&P8=»Columns».»Product»&P9={XSA(‘admin’.’Sample Sales Lite’).»Columns».»Product»}
It’s crucial that when you type the OAC URL in the Data Actions panel, the OAC fields turn blue, as we can see here:
Figure 5: Typing the OAC URL that will allow the user to navigate to OBI.
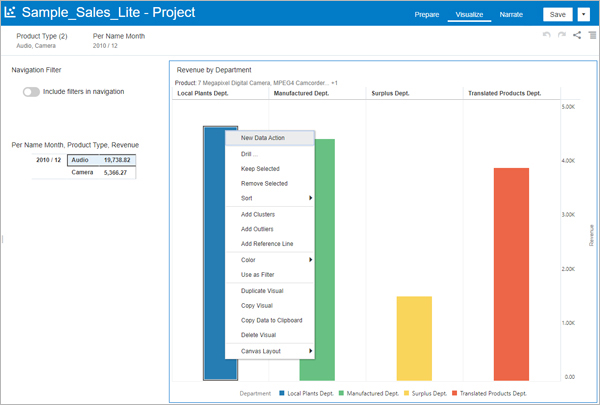
If we right-click on the bar chart and then click on New Data Action, we can see what happens with the toggle button off:
Figure 6: Clicking on a visualization to navigate with the toggle button off.
Figure 7: OBI Dashboard after navigating through a data action.
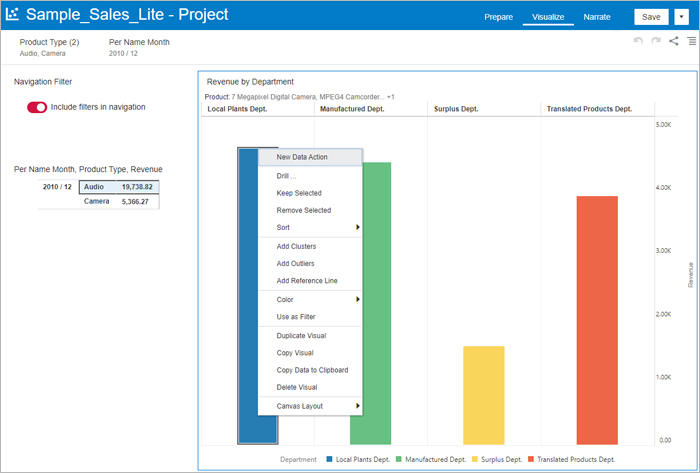
As we can see in Figure 7, nothing happened when navigating, no filter was kept. Now let’s see what happens with the toggle button on:
Figure 8: Clicking on a visualization to navigate with the toggle button on.
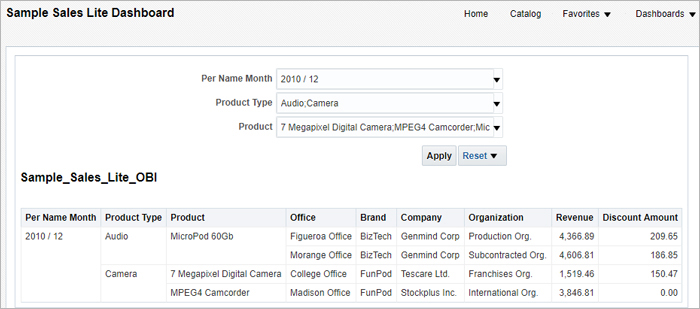
Figure 9: OBI Dashboard after navigating with the filters kept through a data action.
As you can see in Figure 9, both filters have been kept correctly – the visualization filters and those in the filter bar.
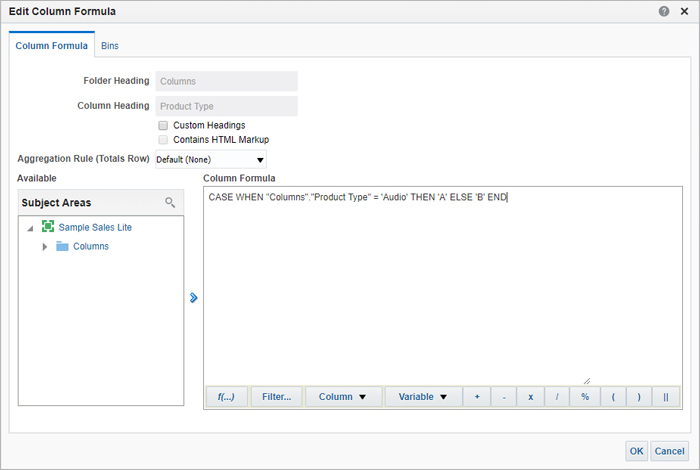
We must add that there is a limitation in OBI when keeping the filters: when a user wants to filter a column that is not directly a field from a subject area, it can’t be done. An example would be a column that in the OBI report is an expression and not a field:
Figure 10: OBI expression to create a calculated column.
Conclusions
In this article we have been able to see the potential of our plugin and the ability of OAC to communicate with other Oracle tools, in this case OBI.
Although navigation through a data action link has some limitations, with simple JavaScript instructions we have been able to solve them, adding value to the user and allowing a better analysis of the data.
At ClearPeaks we are experts in Oracle technologies, always at the cutting edge of new trends and the latest features. If you believe you can benefit from our expertise, please don’t hesitate to contact us – we’ll be pleased to help.

