15 May 2024 How to Use DAX Query View in Power BI Desktop to Improve Model Data Quality
In the November 2023 feature release, a fourth view, the DAX Query View, was introduced to Power BI Desktop. This new feature is designed for Power BI business users, enabling them to write and run DAX queries natively within Power BI. Previously, executing DAX queries was only possible using a third-party external tool or an API.
Model authors can quickly validate data and measures when there is no data warehouse available and without needing to create a visual, publish, or use an additional tool. What’s more, it’s possible to create and update semantic model measures directly from the DAX Query View.
It’s important to note that DAX queries differ from the DAX expressions used to create model items such as measures and calculated columns. The result is always tabular, not singular, similar to SQL queries that return data in a table format.
With this first release, the DAX Query View is only available in Power BI Desktop, although there are plans to extend DAX queries to live-connected reports and the Power BI service.
Below you can see the layout of the DAX Query View:
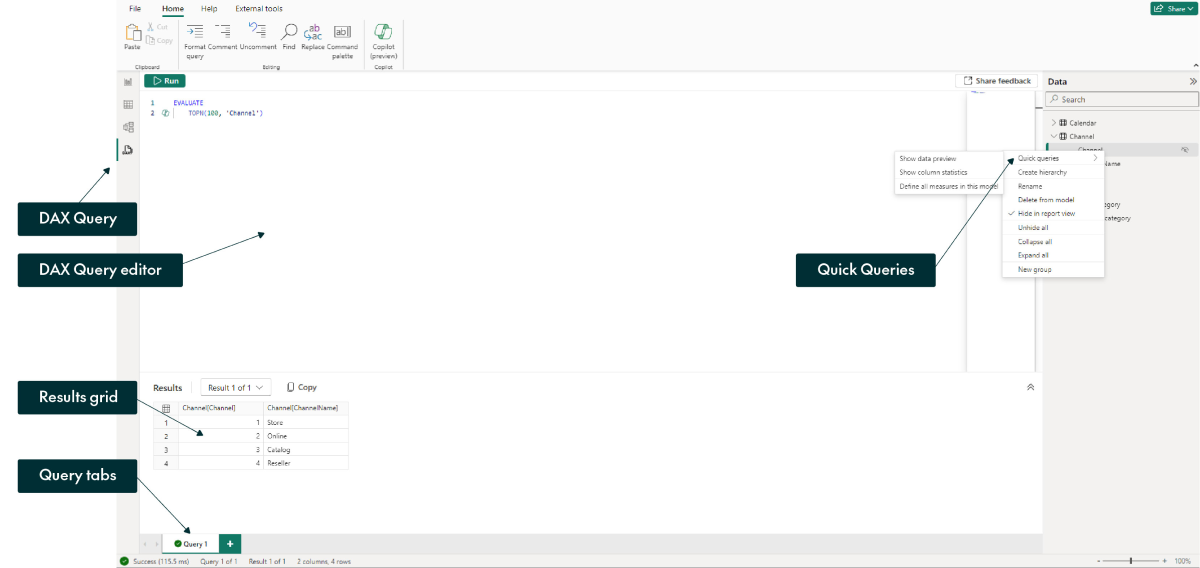
DAX query tabs are kept when the report is saved, so every time the .pbix file is opened, the queries are accessible in the DAX Query View. Each tab can be renamed for the easy identification of individual code snippets.
Data Quality
Data quality is typically defined as the degree to which data meets the specific needs of an organisation within a particular context, and as data is at the heart of all organisational activities, poor data quality can lead to negative business outcomes, such as erroneous decisions and financial losses.
There are six dimensions used to measure the quality of business information: accuracy, completeness, consistency, validity, uniqueness, and timeliness. Good data governance practices include harmonising data from various sources, creating and monitoring data usage policies, and eliminating inconsistencies and inaccuracies to maintain these qualities.
Returning to the Power BI feature we’re looking at today, the DAX Query View can be used by Power BI developers to assess model data quality, allowing users to identify issues such as duplicates, null values, lost data, and incorrect formats.
Example
For this example, we’ll be using the Contoso Sales Power BI Designer file, available here.
We’ll look at a scenario where no data warehouse is available, so all raw data is imported into Power BI and modelled using Power Query.
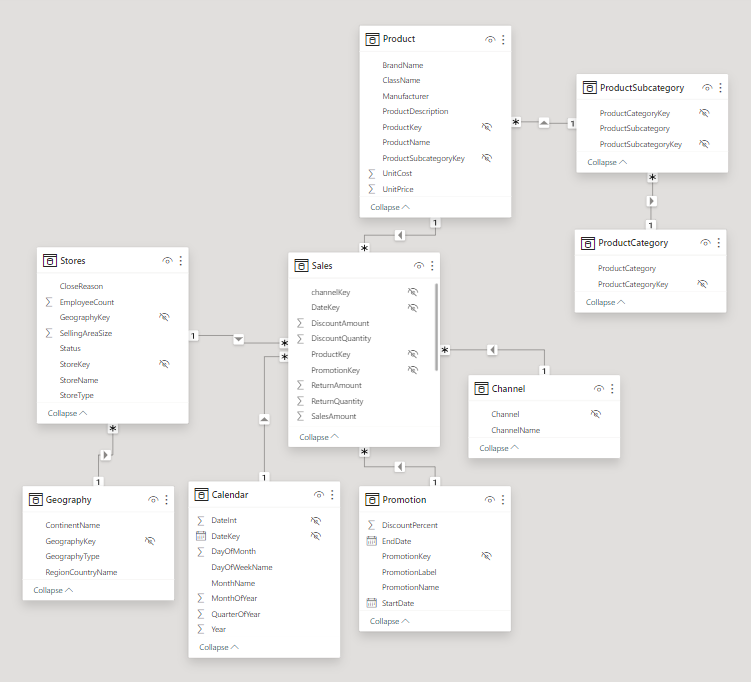
You can see the model below:
How to Use the DAX Query Editor
As mentioned earlier, the DAX Query View in Power BI enables users to create DAX queries, which differ from DAX formulas. A DAX query is like an SQL query and is used to view data in the model.
There are two main parts to a DAX query:
- EVALUATE (required): This statement is necessary to specify the table expression that contains the data to be viewed. A DAX query can contain multiple EVALUATE statements.
- DEFINE (optional): This statement is used to specify measures and variable definitions that enhance the functionality of the EVALUATE statements.
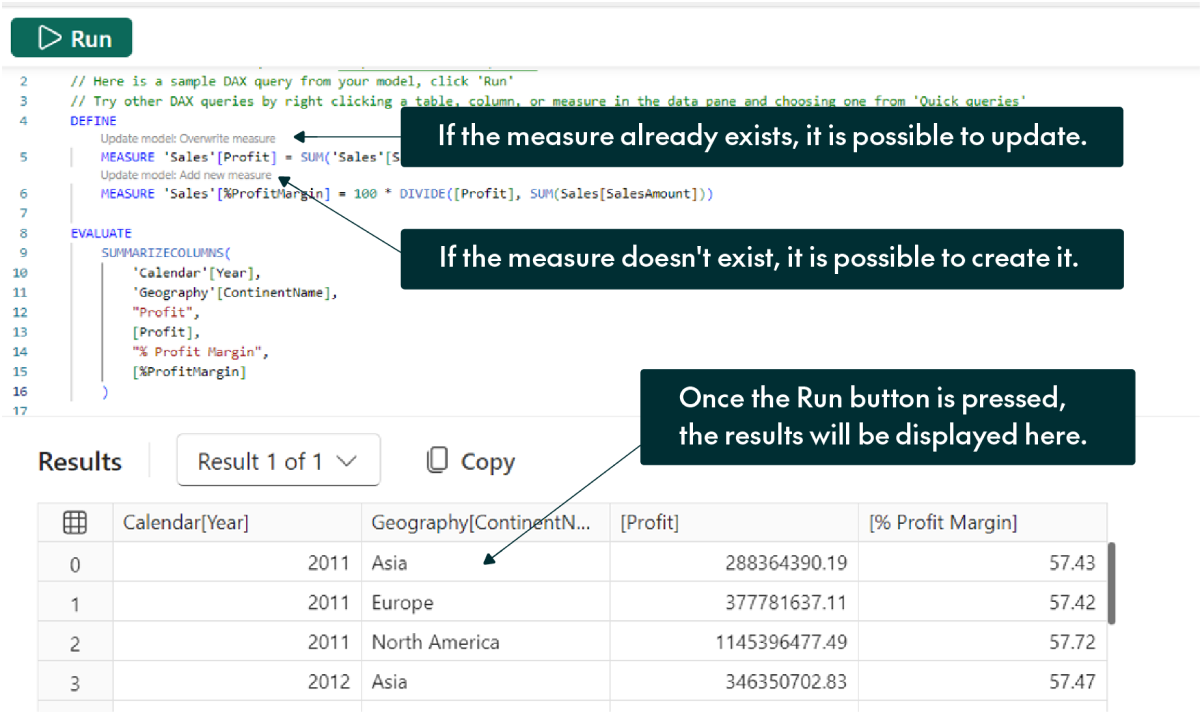
Inside the DAX Query View, users can define or modify measures that already exist in the model. These changes are temporary and only affect that specific DAX query session, so users can experiment with modifications. There is also an option to permanently update the measures in the model based on the changes made during the session.
Another Power BI feature called Quick Queries helps users to start their queries more efficiently. For instance, to view the top 100 rows of the Sales table, simply right-click on Sales in the data pane, then select Quick Queries > Show top 100 rows:
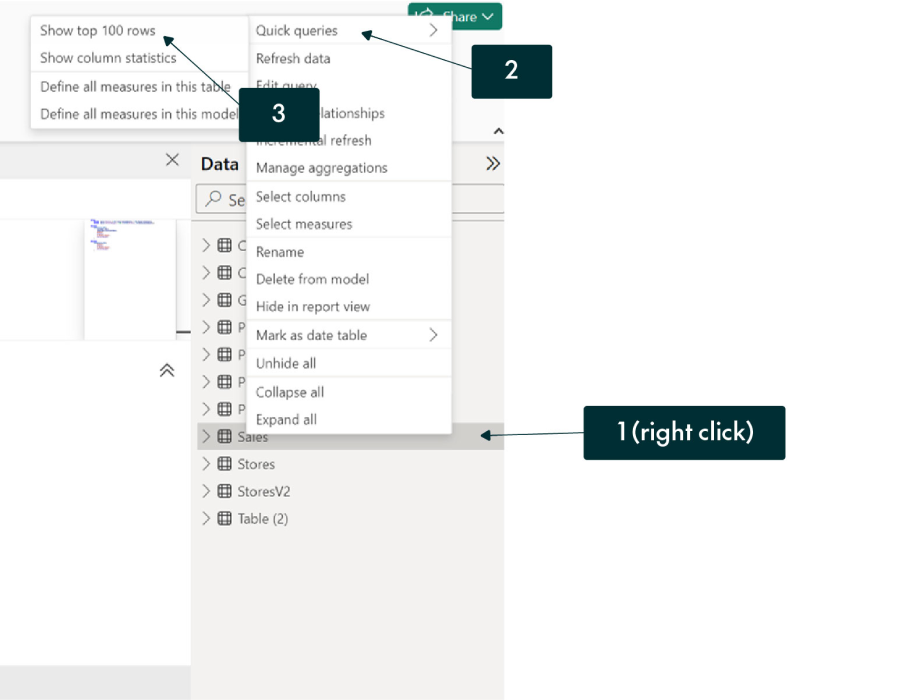
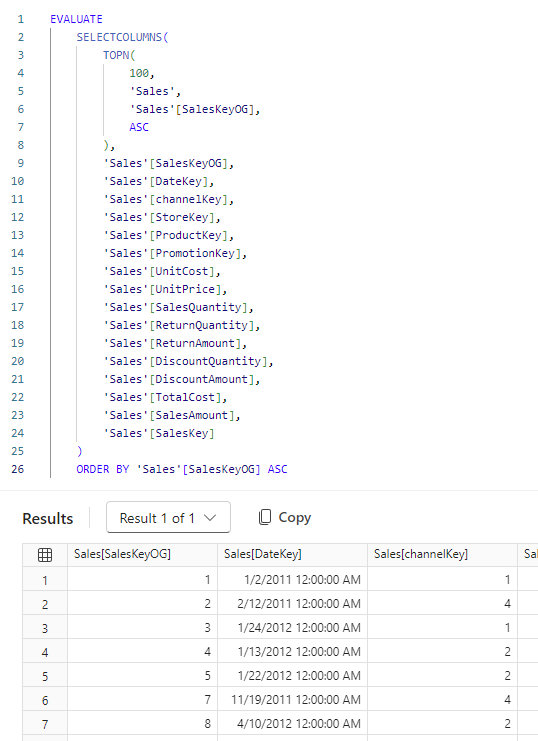
With this quick query, you can easily exclude (or comment out) unnecessary columns from the results, modify the number of displayed rows, adjust the order, and more.
Null Check
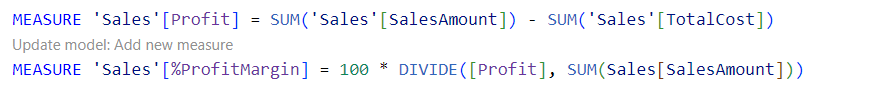
For this example, two measures were created, Profit and % Profit Margin; see the DAX definition below:
To simulate a scenario where null values may occur, imagine there was an issue with the data load causing all online stores to have IDs that do not exist in the fact table. Consequently, when the join is performed, some stores will appear with null dimensions because their IDs cannot be found:
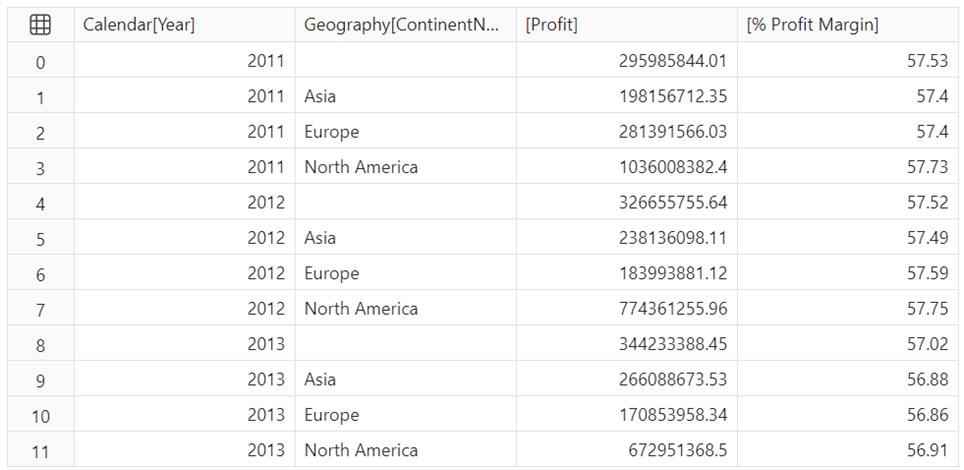
As can be seen above, the blank values are in the Geography table. The tables are joined using the StoreKey column, so the focus for finding a solution should be on checking the values in this column:
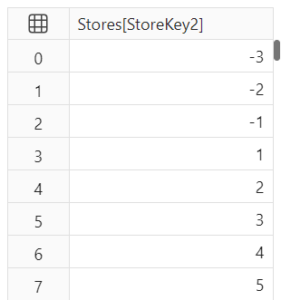
The first few rows display the values that are causing blanks in the ContinentName column. Since the expected values are greater than 0, as they appear in the fact table, the online stores cannot be associated with any continent.
Duplicates Check
In the Contoso data model, the Sales table is the fact table around which the model is built. It is possible to check duplicates using the DAX Query Editor like in a SQL-based database.
In this fact table, each sale is identified by a unique value, named SalesKey, so this column will be used as the primary key in the example. Below is a sample of the code that could be used:
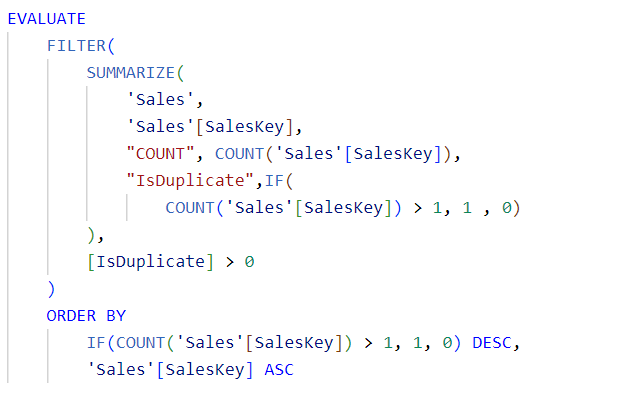
In the figure above, the COUNT column shows the number of rows for each SalesKey, while the IsDuplicate column indicates whether a row is duplicated. Duplicates can be detected if the COUNT column exceeds 1 or if the IsDuplicate value is 1.
A filter has been applied to display only the duplicated rows, those for which IsDuplicate is equal to 1.
Below you can see the query results:
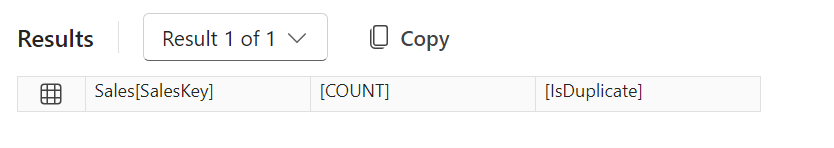
As there are no rows in the results grid, the model has no duplicates.
Imagine that the process to assign the SalesKey fails, resulting in two rows receiving the value 1. If the same query is run under these conditions, the results would appear as shown below:
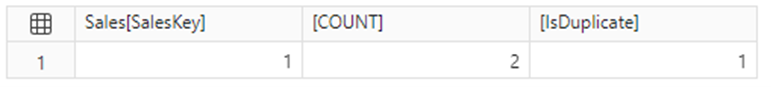
The query shows the value of each row to address duplicates in the fact table.
Format Check
Another important aspect to check is whether values are in the expected format; the DAX Query View can also be used for this purpose. For example, to verify that each person has been assigned an email, an ‘@’ should appear in every row of the Email column.
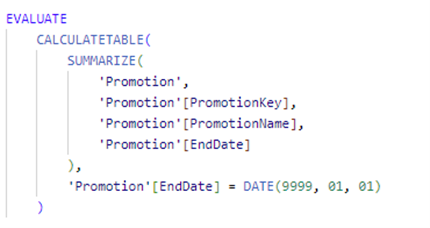
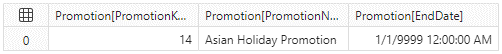
In the example dataset, there is no such column, so the focus will shift to verifying if there are any incorrect dates listed as end dates for promotions. Below is an example of the promotion table:
![]()
The default value for the column is 01/01/9999, so if the user doesn’t modify it or if there is an error while loading it, the discount will remain indefinitely valid.
Consequently, it is essential to verify whether there are any incorrect dates:
The results are as follows:
Promotion 14, related to the Asian holidays, is not well defined as it seems to never end.
Test Schema
A great way to automate data quality in the report is with a standard test structure for each item, as suggested by Anelle Kerski in her DataOps series. Since DAX query tabs are saved with the model, it is possible to build a script that encapsulates all the tests needed to check the model every time there’s a change.
Let’s consider a scenario for our model where validation is possible based on the following points, noting that the tests relate to the aspects discussed above:
- The number of rows containing distinct primary keys in the fact table should match the total number of rows.
- The EndDate range for the promotions should be coherent.
- The query used for the Null Check above should not return null values.
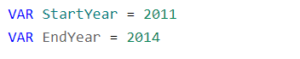
The first step is to set the filter definitions to snapshot the results as the data grows; these filters must be static. In our case, we are only considering data from 2011 to 2014, as this is the only period when the fact table is validated, so it is the only one that needs to be checked when a transformation is carried out, to ensure that results that were correct in the past are not altered:
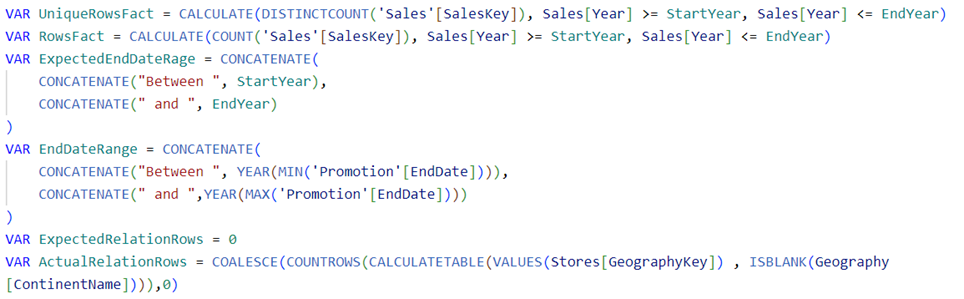
Next, we need to declare the variables that contain the expected and actual values of the three tests:
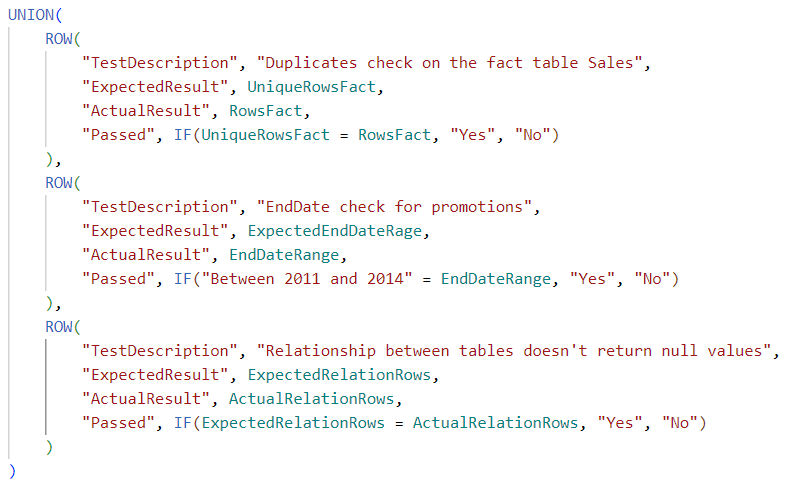
Then we create a table that displays the results using the union function:
Once all the code has been executed, the following results will be shown:
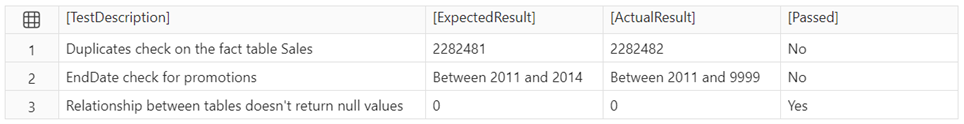
The first column provides a description of the test performed, the second shows the expected result, and the third displays the result obtained with the current model; the last column indicates whether the test was passed, making it easier to read.
From the results, it is evident that the model requires further inspection, as 2 out of 3 tests failed.
The advantage of employing a file like the one described is that it is accessible to both technical and non-technical users. What’s more, this streamlined process means a quicker verification of each item, reducing the time required to implement solutions.
Conclusions
The DAX Query View is a powerful new feature that enables Power BI developers to streamline data quality checks, eliminating reliance on third-party tools. Although DAX queries differ from DAX expressions, developers familiar with expressions will not face a significant technical challenge in adapting to DAX queries. Power BI also enhances usability by automatically saving each query tab every time a report is saved, ensuring that tests can be replicated as needed.
If you have any questions about this article or need further assistance with Power BI and DAX queries, please do not hesitate to contact us. Our experienced and certified team of experts are here to help you streamline your data analysis and to optimise your reporting capabilities!