30 May 2024 Highlights from the Oracle Analytics Cloud May 2024 Update
Welcome back to our Oracle Analytics Cloud (OAC) blog series for another insightful journey through the realm of data empowerment and innovation. We are thrilled to share the new May 2024 enhancements and updates with you, all of which reflect the continuous and innovative efforts Oracle is investing in this powerful tool. You can also check out our last two update posts for January and March 2024, to help you get a clearer idea of what has been going on in OAC this year.
Now let’s jump straight into what’s new in OAC – we’ve already explored and tested the most interesting features now available, and we’d like to offer you our insights!
Using Parameters to Automate Filters to Exclude Specific Values
Oracle continues increasing the capabilities of parameters, and in this release there’s a new feature that leverages them for filtering purposes: we’ll walk you through it and its implementation. In our previous posts, we tested and demonstrated other parameter features, like in our latest one about the March 2024 release.
In this new release, the use of parameters for filtering involves flipping the default filter section from Include to Exclude. This enhancement allows for more efficient data management across your entire dashboard, not just in individual visualisations.
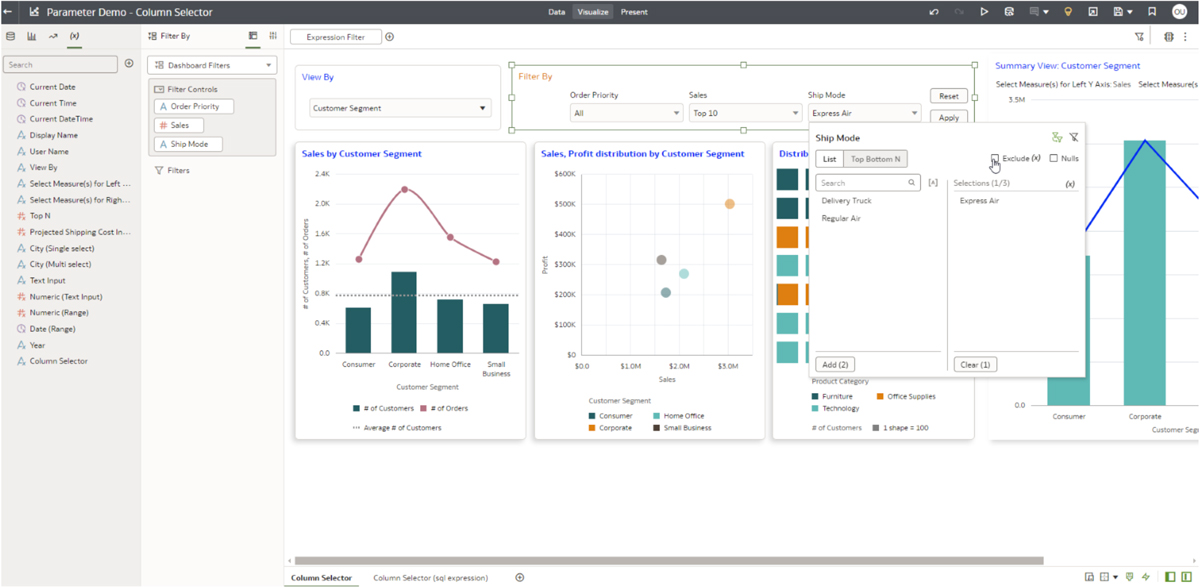
To implement this functionality, first navigate to the workbook containing the dashboard filters and some common filter columns. Open one of the filters and bind a parameter to the selection. The same parameter is also bound to the column in the second workbook.
In the top right corner, you will see the option to switch the filter from Include to Exclude. Select Exclude, then click on (x) to open the submenu for further configuration:
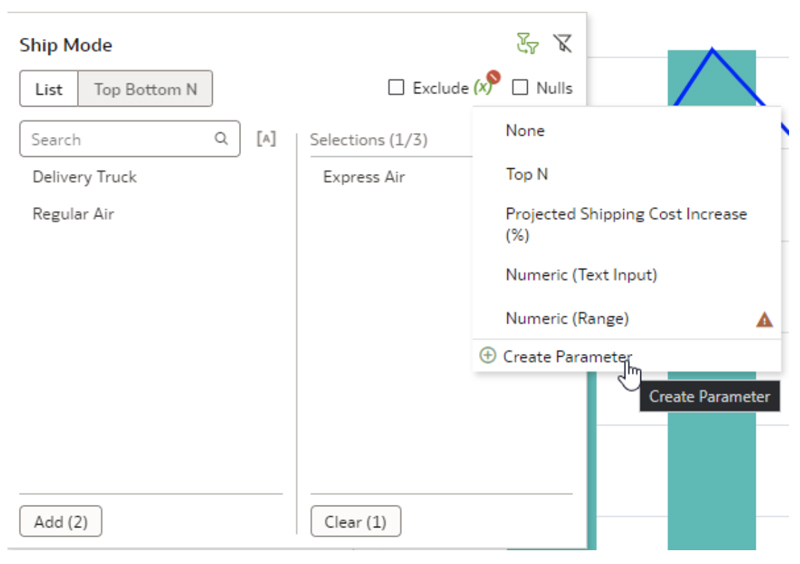
Secondly, at the bottom of the options, select Create Parameter to bind the Exclude mode option on filters to its parameter. Think of it as generating an object that you can drag and drop onto any filtering option, which will replicate the selection you have set up here:
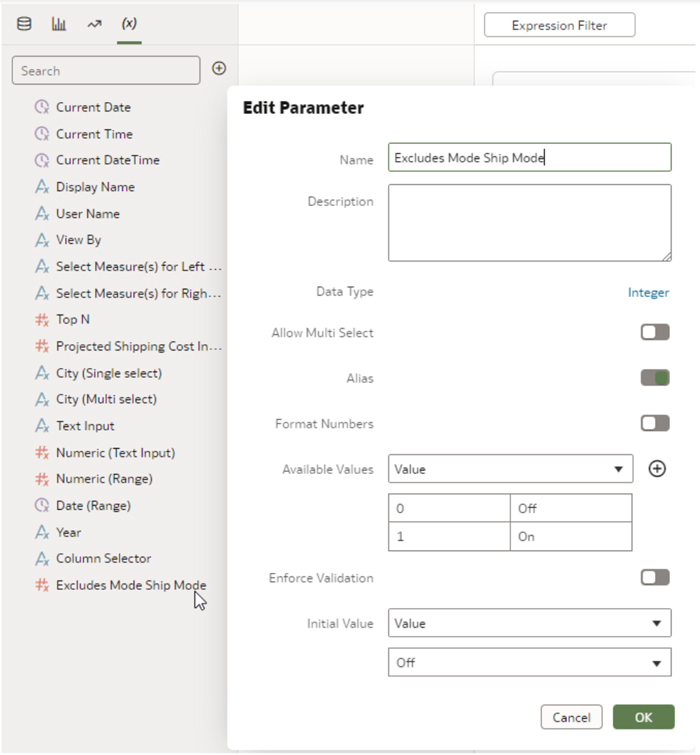
On the left-hand side of the parameter tab, select Edit Parameter, and you will notice that the parameter bound to the Exclude option is a Boolean parameter with two values: ‘0’ indicating that the parameter is off, and ‘1’, indicating that it is on:
This functionality can be used on other canvases or set as default for the entire dashboard. It will appear as an option whenever the source field is available.
Flexible Canvas Display Based on Breakpoints
In this release, the canvas display is designed to be flexible and responsive, adapting seamlessly to various screen sizes and resolutions. This flexibility is achieved through Breakpoints, predefined screen widths at which the canvas layout adjusts to provide an optimal viewing experience.
By leveraging these breakpoints, you can ensure that your visualisations and dashboards remain accessible and user-friendly across different devices, whereas in previous OAC releases the auto-scale feature primarily focused on making visualisations and text smaller without adjusting the overall layout, often leading to a diminished user experience on smaller screens as the visualisations became too small to read comfortably.
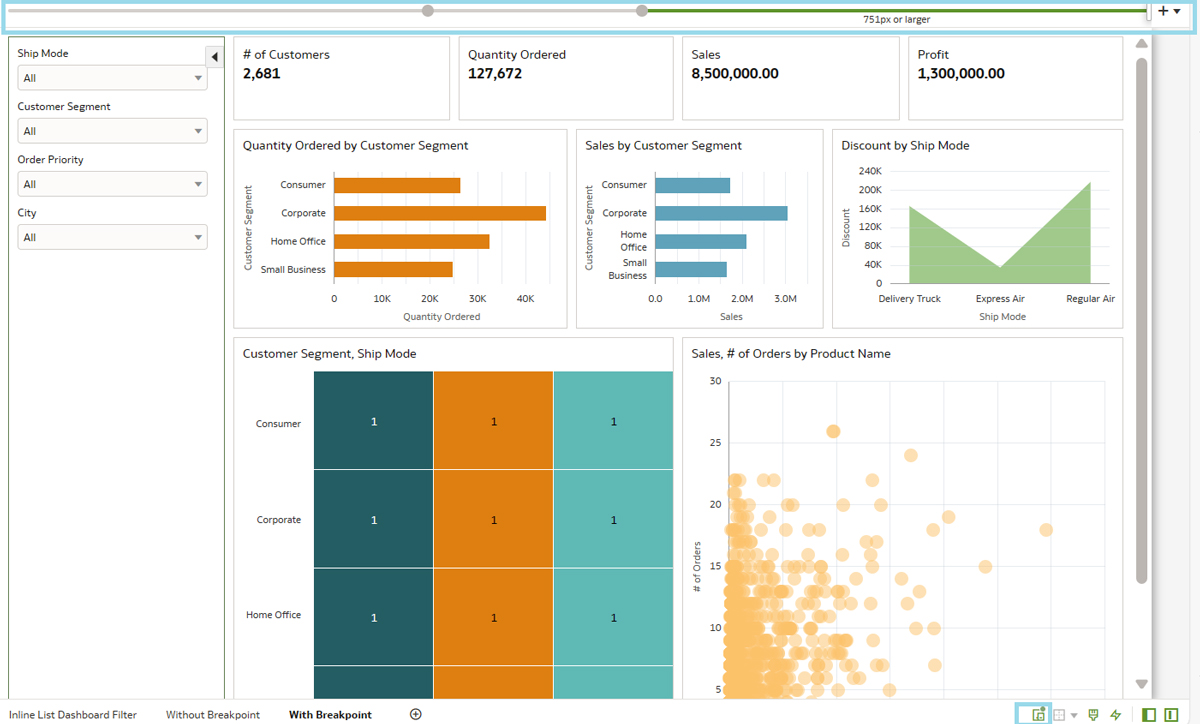
This new release also introduces enhanced screen responsiveness to ensure an optimal viewing experience across various devices. First, open the dashboard in Author Mode, then navigate to the bottom of the screen and turn on the newly added Responsive Canvas Editor icon. Once activated, a slider will appear at the top of the screen, allowing you to define the screen size and layout of the canvas content:
Next, move the slider to define the screen size by creating a breakpoint and reorder the visuals to ensure they are easily readable. You can create multiple breakpoints to accommodate various screen sizes.
To demonstrate this with an example, we will create two breakpoints and organise the layout using common display sizes for tablet and mobile.
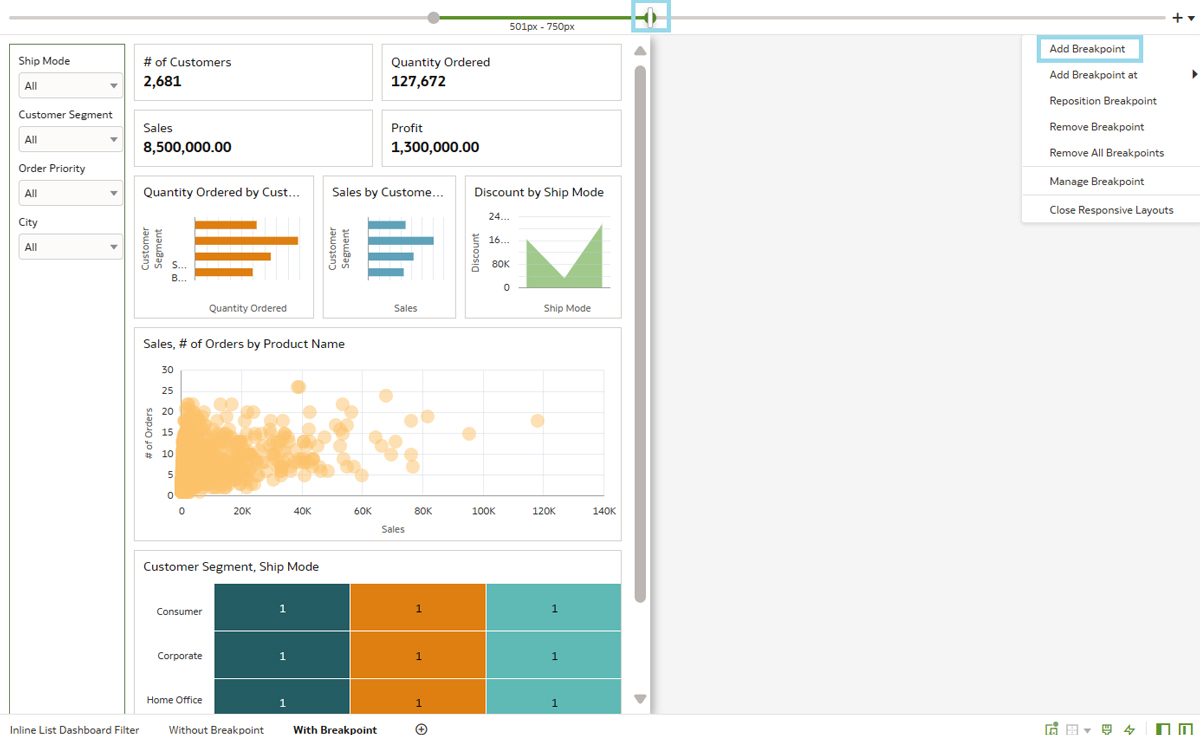
The screenshot below shows the adding of a breakpoint at a 750-pixel screen size and the reordering of the visuals to look better on a tablet – tiles in two rows, with the scatter plot and heatmap one below the other, rather than side by side:
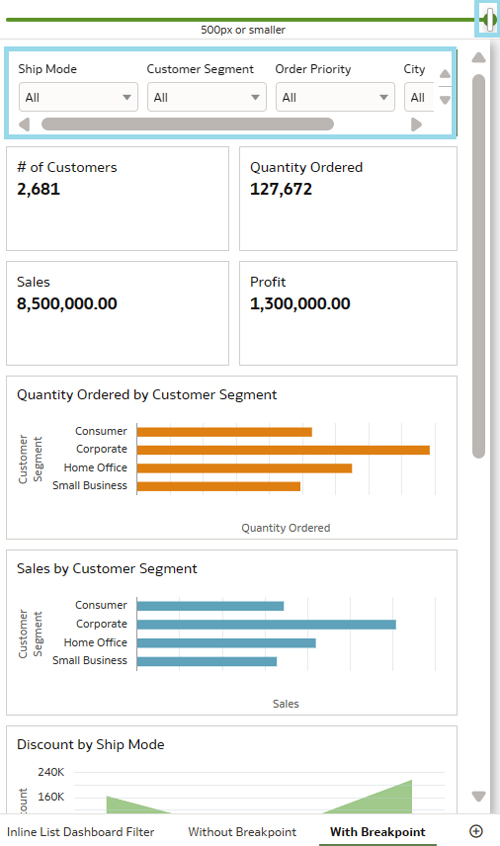
The next screenshot shows the addition of a breakpoint at a 500-pixel screen size and the reordering of the visuals to look better on mobile – tiles in two rows and the remaining graphical visuals on top of each other. We can also align the filter from a vertical to a horizontal direction for an enhanced view:
Below, you can see how the created canvas works without and with breakpoint:
Inline List Dashboard Filter
The Inline List Dashboard Filter type is a new feature that enhances the OAC filtering experience. It allows users to select multiple filter values directly from a list displayed inline within the dashboard, making their application easier and more intuitive. This is a fantastic addition, improving the interactivity and user-friendliness of your dashboards, providing a better overall experience when exploring and analysing your data. The Inline List Filter allows users to choose either a checkbox or a radio button, with the default option being a checkbox.
To use it, first open a dashboard, navigate to the Dashboard Controls section, and create a Dashboard Filter. Once created, drag the list of fields from the existing dataset to the Filter Controls section, then click on the Properties icon and navigate to Filter Controls:
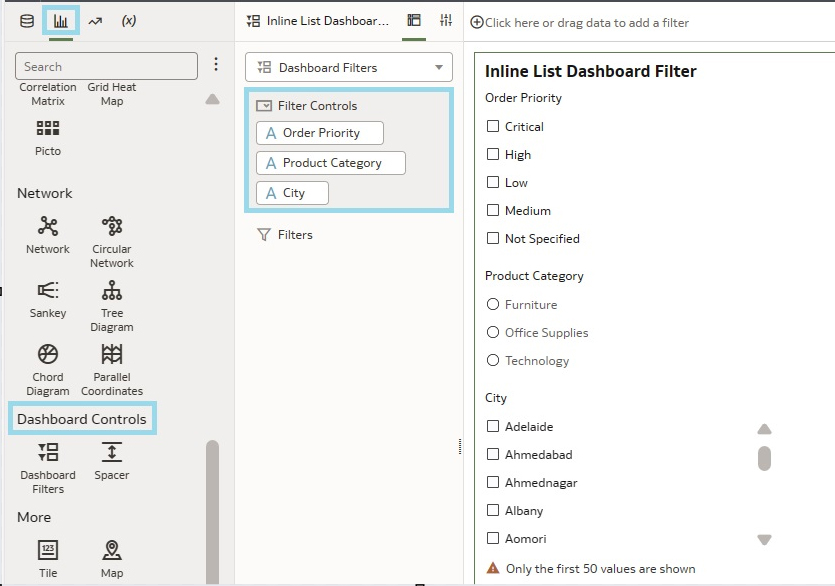
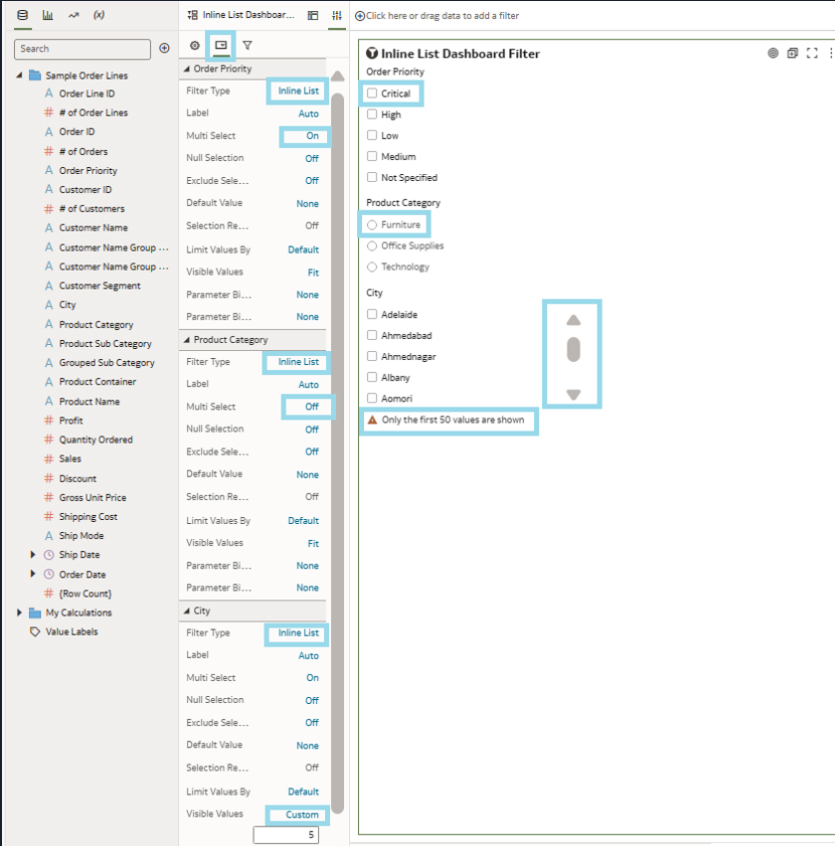
In the next step, set the filter type to Inline List by expanding the filter field, which will initially render the filter values as checkboxes. You can modify this to display filter values as radio buttons by toggling the Multi-Select property from On to Off.
Additionally, there are other properties available, such as another filter. The Visible Values property is unique to the Inline List, allowing you to customise which values are displayed. This customisation can limit the displayed values, whilst the remaining values can be accessed through scrolling:
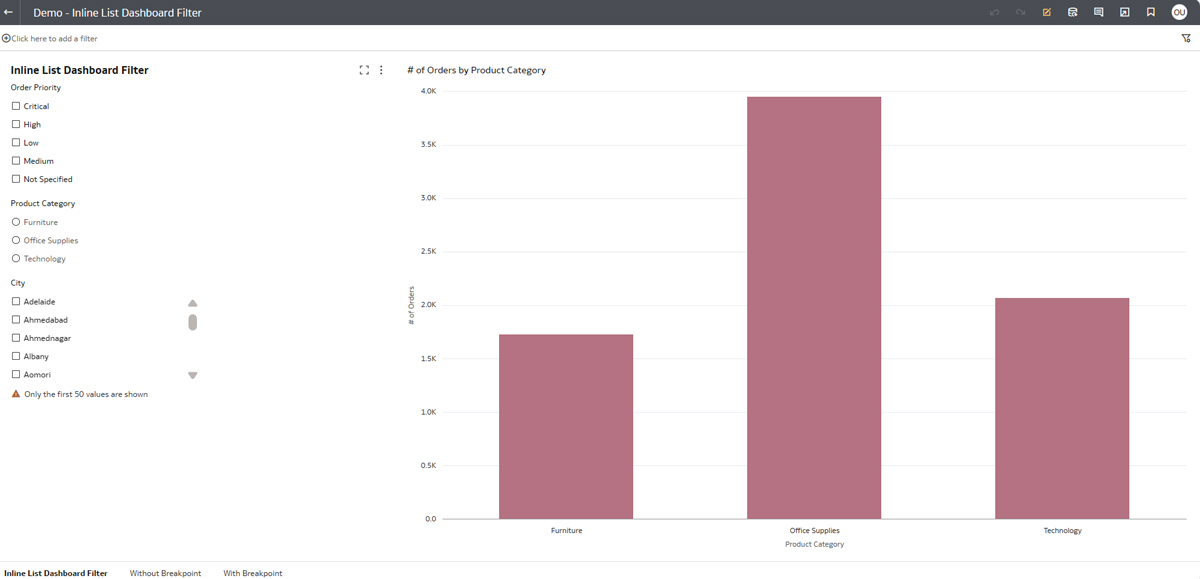
In the following image, we have followed the same steps for each filter field to showcase all three options:
Excel, CSV, and TSV File Filter Improvements
Next, let’s explore a new approach to leveraging dataset generation directly on OAC. We’ll go through a scenario to highlight why generating them from these types of files is a massive improvement!
Let’s imagine we have a file containing information about multiple clients, and we need to generate a dashboard for only one of them. It’s essential to filter this data before creating the dashboard, to guarantee that sensitive information isn’t inadvertently exposed while modifying filters within the dashboard. With this approach, we can do what we need without having to modify the original file, thus maintaining data integrity and privacy.
When generating a new dataset, we can utilise various sources, and one of the most common sources for manual processes or ad hoc analysis is an Excel-type file, such as a CSV (comma-separated values) or TSV (tab-separated values). Oracle has now introduced a new functionality that allows filtering data directly on the Extraction page, eliminating the need to stage all the data and filter it once on the canvas.
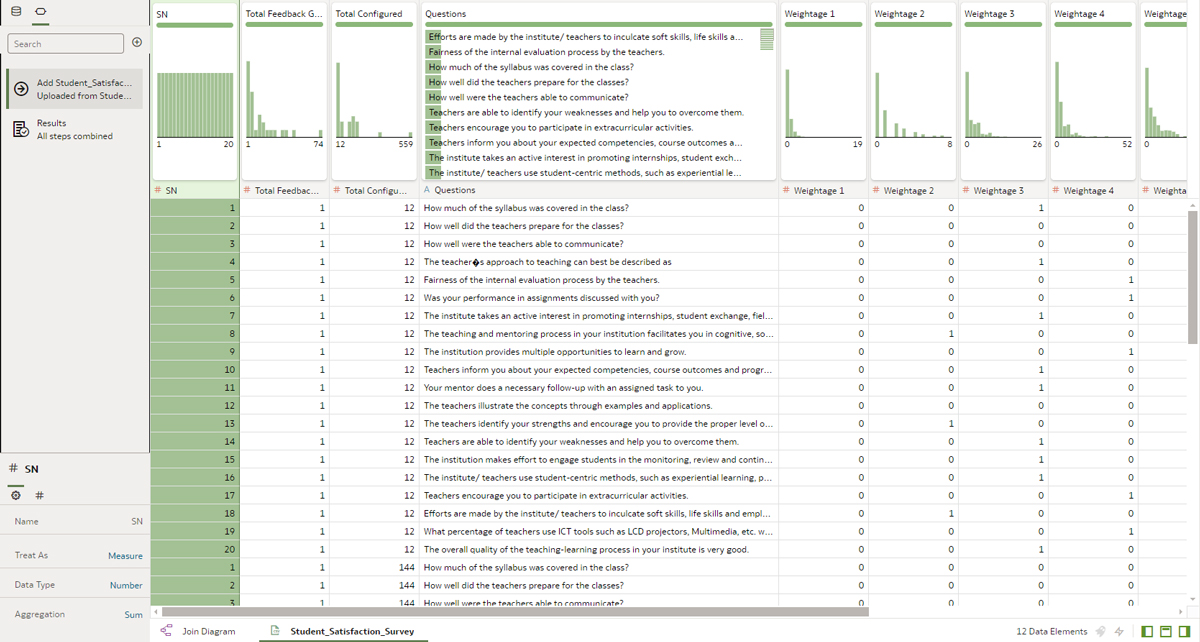
Now we can dive into the steps we need to follow. First, click on the Create Dataset button located in the top right corner, then choose the source file type as either CSV or TSV, and open it. This action will take you to this page:
Now, there’s a handy option to apply filters directly instead of manually right-clicking on the fields. This feature allows you to leverage specific values, expressions, and parameters, essentially functioning as a one-off transformation and load feature. It’s particularly useful when you only need a subset of the original file without modifications, or when lacking write or edit permissions. This enhancement significantly improves user experience and makes the tool more intuitive, especially for new developers.
Additionally, Oracle has introduced a feature that enhances the ability to export table or pivot table content directly from visualisations embedded in another application or web page to Excel. This facilitates the extraction of data from OAC visualisations for further analysis or reporting in Excel, allowing users to work with their data outside the OAC environment.
Other Features
OAC has also introduced several cutting-edge functionalities for augmented analytics and machine learning. These enhancements include face recognition capabilities and PII (Personal Information Identification) data obfuscation within Data Flows. Although we haven’t covered these features extensively in our regular Oracle update articles, they represent a significant advancement in integrating AI-driven tools into OAC.
What’s more, there is a notable update to the Console concerning permission settings: in the latest version, users can now set permissions at a finer granularity for different pages, eliminating the need to grant broad, generic permissions. This improvement enhances security by allowing for more precise access control. For example, users can grant access to the Virus Scanner without providing permission to modify connections, significantly reducing the risks associated with overly broad permissions.
Conclusion
In this Analytics Cloud release, Oracle has introduced some features and improvements that align with our own vision for the product. The focus remains on leveraging existing assets and enhancing the UX for both developers and end-users. In this blog post we’ve highlighted new parameter usage, flexible canvas scaling with breakpoints, and enhanced filtering tools for dashboards and datasets. Oracle has added greater depth to the existing toolset whilst maintaining the clear and simple data visualisation experience their users expect.
We’re committed to providing regular coverage of Oracle Analytics Cloud updates and other Oracle software topics throughout 2024 and beyond, so be sure to stay tuned to our blog for the latest insights.
Our team at ClearPeaks is here to support you in exploring the full potential of the latest OAC features. Whether you need a detailed walkthrough of what’s new, guidance on applying these features to your data, or simply have some questions, our experts are ready to assist. Connect with us today to unleash the full power of OAC and transform your data analytics into captivating visual narratives!