09 Apr 2025 Highlights from the Oracle Analytics Cloud March 2025 Update
Oracle Analytics Cloud keeps getting better! The OAC March 2025 Update brings new features and improvements that enhance your experience, making it easier to use and providing more ways to look at your data. In this article we’ll review the most exciting elements of this new release and explain everything you need to know to improve your OAC experience.
Create Gauge Visualisations
The OAC March update introduces gauge visualisations, designed to present a single metric value in a way that is instantly interpretable and visually appealing. These visualisations are used to represent important KPIs (for example, sales targets, customer satisfaction scores, etc.) and can also be used as a performance indicator by comparing the current value of a metric against a desired value. You can find them in the More section of the Visualization Pane:
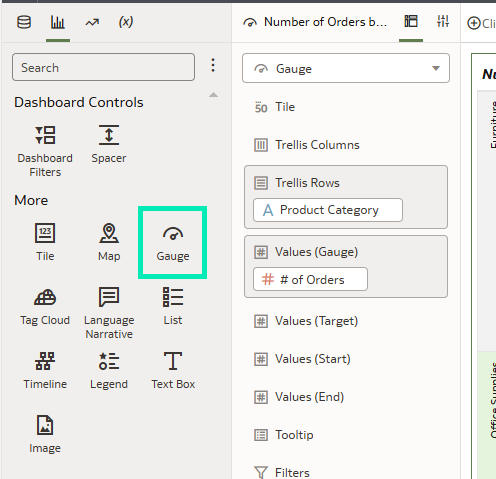
Figure 01: Gauge Chart Icon
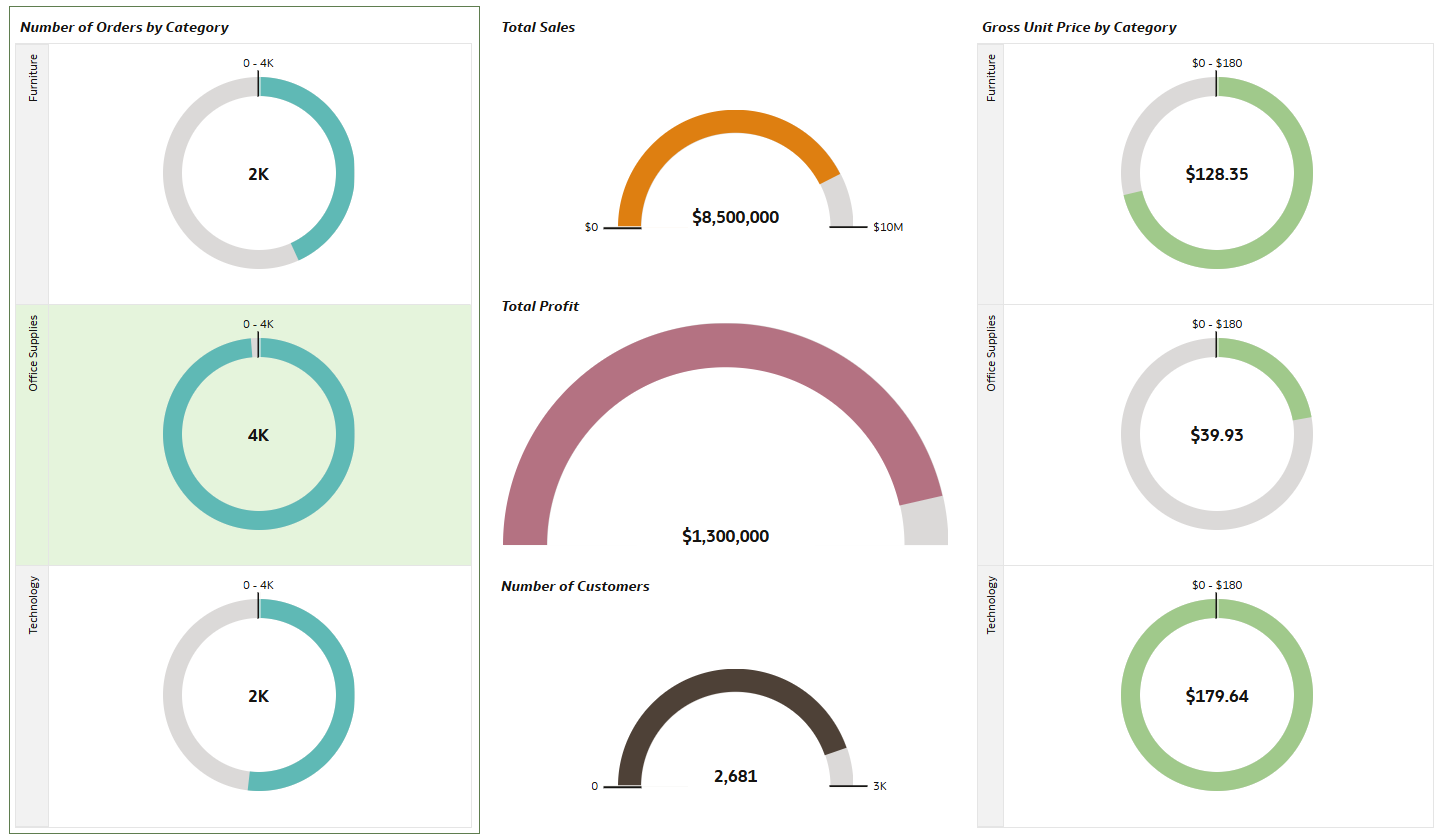
Figure 02: Gauge Chart Examples
The grammar allows us to specify the values for the gauge to display, as well as to define the target value:
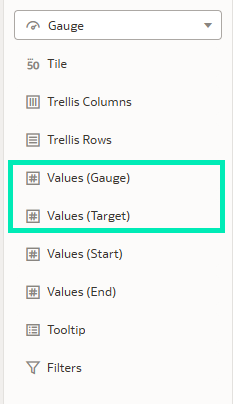
Figure 03: Gauge Grammar
Adding a target value helps to provide clarity on KPI performance by highlighting how close the metric is to meeting or surpassing the goal:
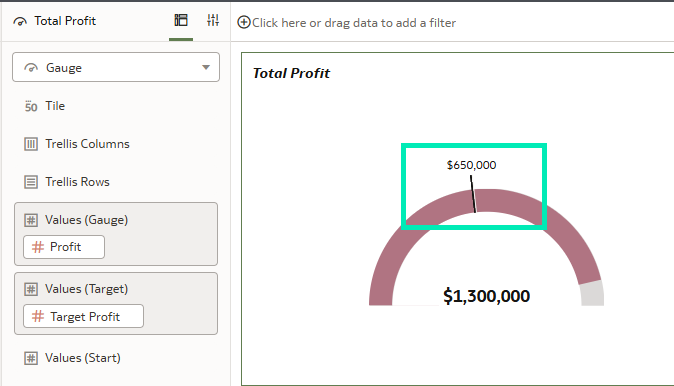
Figure 04: Target Value
Oracle has also added additional customisation parameters for gauge visualisations. In the general tab of the Property panel, you’ll see the new Gauge section with properties specific to the gauge chart:
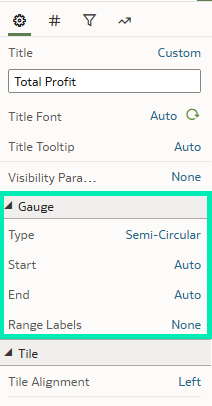
Figure 05: Target Values
These customisation options let you define whether the chart is circular or semi-circular and configure the value range of the chart according to your specific requirements and workbook design.
Gauge visualisations are an excellent addition to dashboards as they provide quick insights into key metrics, speeding up decision-making.
Display Web Links with Custom Images in Custom Groups
When it comes to Home page personalisation, Custom Groups is a powerful tool that enables quick access to your preferred items by grouping and displaying them in one place:
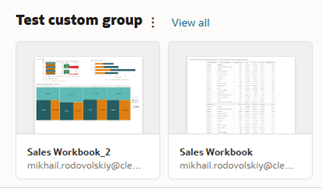
Figure 06: Custom Groups
Now, with the March update, you can add custom images to URL links. Instead of the default link icon, you can customise its appearance and personalise the Home page:
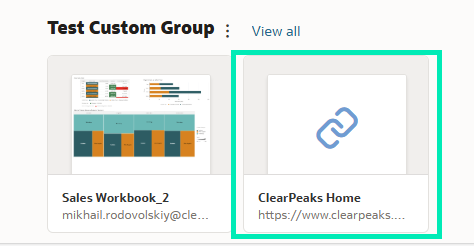
Figure 07: URL Item
You can modify already existing links or add an image while setting up a new one:
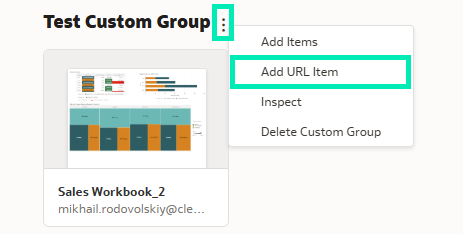
Figure 08: Negative Value Formatting
Fill in the two text boxes to enable a new feature introduced in the March update: selecting a thumbnail for the URL item.
In the Create URL Item panel, a new optional parameter has been added: Thumbnail. You can either drag and drop an image into this field or select one from your computer:
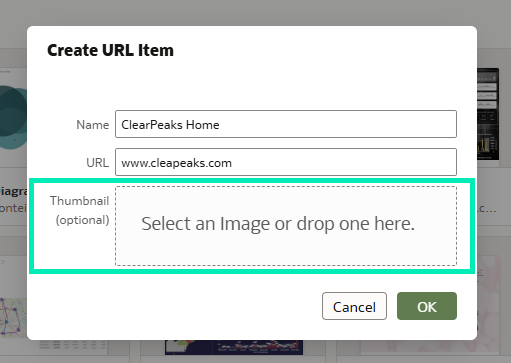
Figure 09: Thumbnail Option
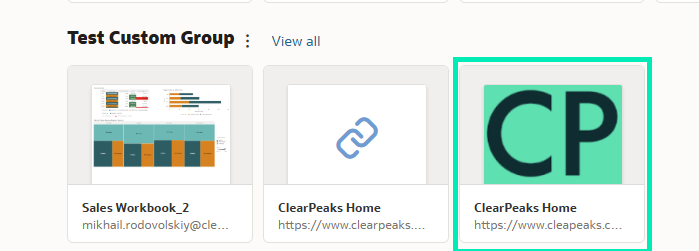
Figure 10: Custom Image
This ability to use custom images in OAC offers a straightforward yet valuable enhancement to the interface, enabling you to create a more personalised Home page, improving both visual appeal and usability, as well as facilitating navigation by making key links more visible and easier to locate.
Create Action Links from Table Cell Values
Another powerful new feature is the ability to create action links directly from table cell values. This feature adds a new level of interactivity to OAC dashboards, allowing users to navigate straight from data points to detailed insights.
A data action link lets users pass context values to external URLs and apply filters to other workbooks or visualisations. In our previous blog post covering the September 2023 Updates, we explored how to create data actions from tiles, and now, as of the March 2025 update, this feature is available for table and pivot table values.
In general, the process of setting up a data action is the same as in other visualisations: anchoring the action to the desired column using the Data Actions menu:
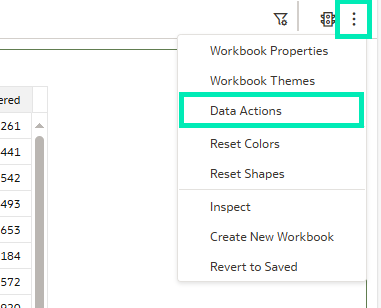
Figure 11: Data Action Menu
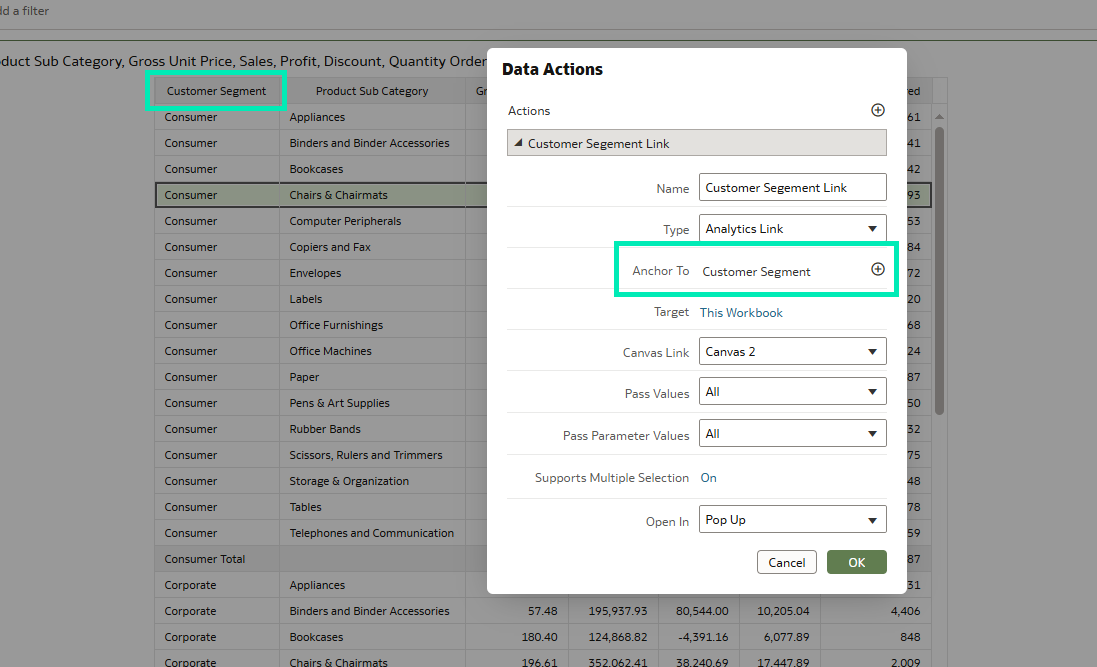
Figure 12: Data Action Setup
To trigger the data action, simply right-click on a cell value within the table, and the configured action will appear in the pop-up context menu for immediate selection:
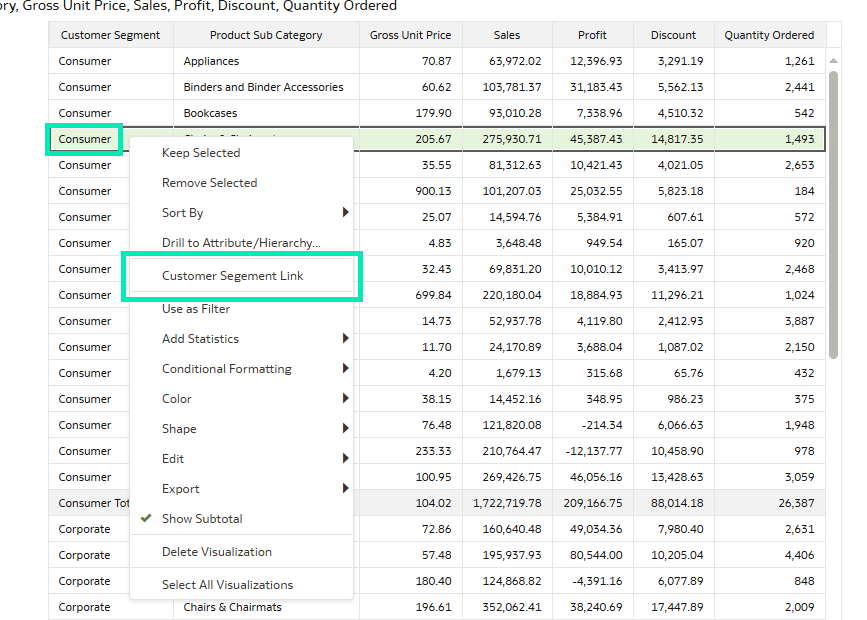
Figure 13: Data Action Setup
The standout feature of this update is the ability to render data action links as visible hyperlinks, optimising the user experience by making data actions more intuitive and easily discoverable. When this feature is activated, all values within the selected column that have associated data actions are displayed as hyperlinks, and when you hover over a cell, the value is visually highlighted in hyperlink format:
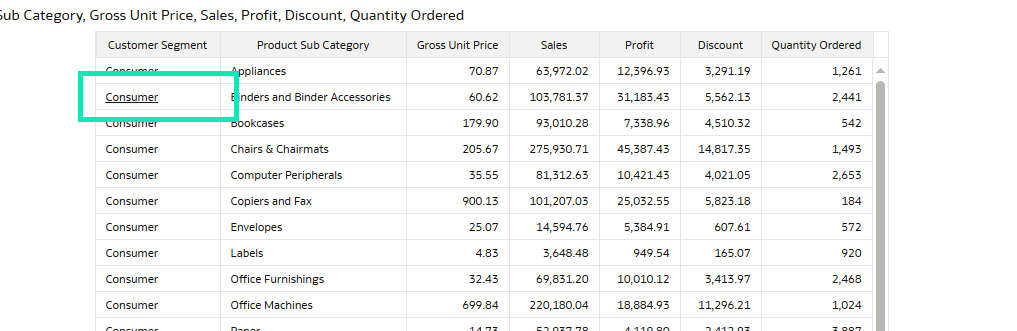
Figure 14: Action Link
The switch for this feature is located in the second tab of the Options panel under the Properties section of each column of the table:
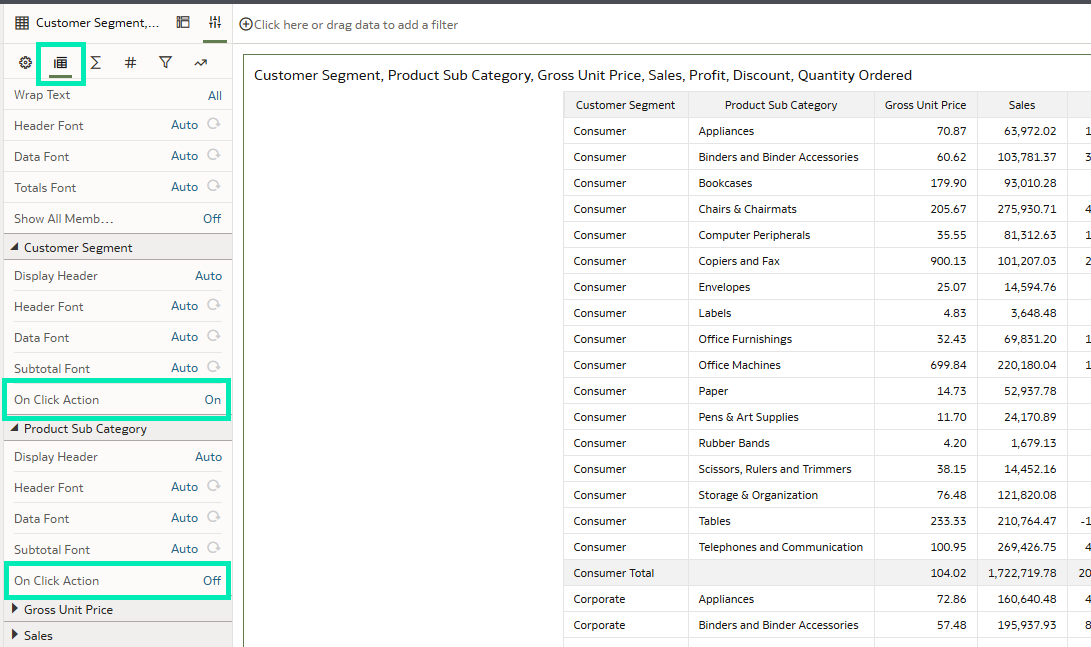
Figure 15: Action Link Setup
These integrated action links transform dashboards from static displays into powerful interactive tools that let users drill down into insights and streamline their analytical workflows.
Create Calculation Folders and Sort Calculations
Dashboards often rely on numerous custom calculated fields, which can lead to long lists of calculations and subfolders that take ages to scroll through. With the March 2025 update, this problem is solved by introducing sorting options for them.
Now, when you right-click on the My Calculations folder or any of its subfolders, the new Sort option pops up and you can choose to sort fields in ascending or descending order, or to leave them unsorted:
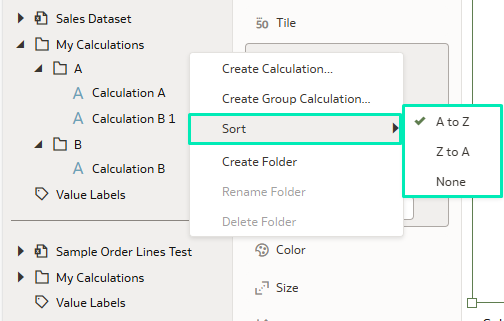
Figure 16: Action Link Setup
This enhancement simplifies the organisation of custom fields in the workbook, offering a clearer and more structured view of calculations. It also makes navigating through them faster and more efficient.
Oracle Analytics AI Assistant with Third-Party LLM
This update also provides the ability to use a third-party large language model in the Oracle Analytics AI Assistant, a tool that helps users to interact with their data using natural language, allowing them to ask questions, generate visualisations, and explore deeper layers of data that may not be immediately visible. The use of a third-party LLM provides access to a broader range of supporting information, whilst Oracle’s default language model focuses exclusively on analysing and providing insights from your data.
The LLM configuration is in the Console under Extensions and Enrichments:
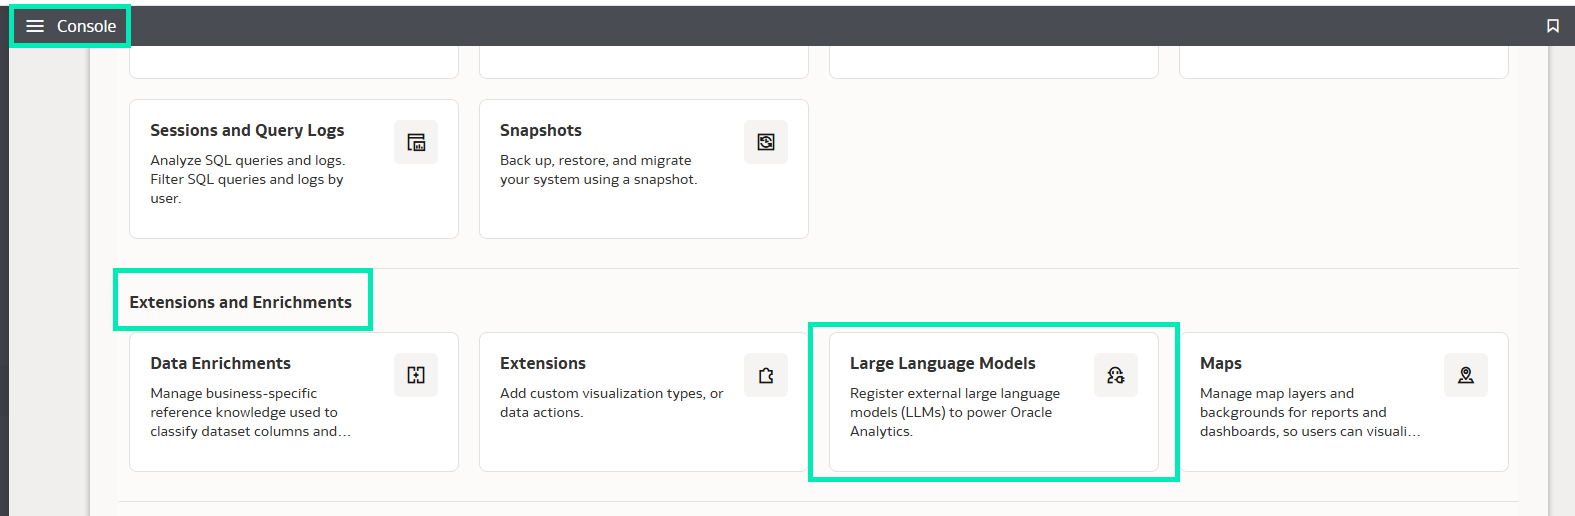
Figure 17: Console
Here, you can register a new LLM by choosing the LLM provider and the model itself:
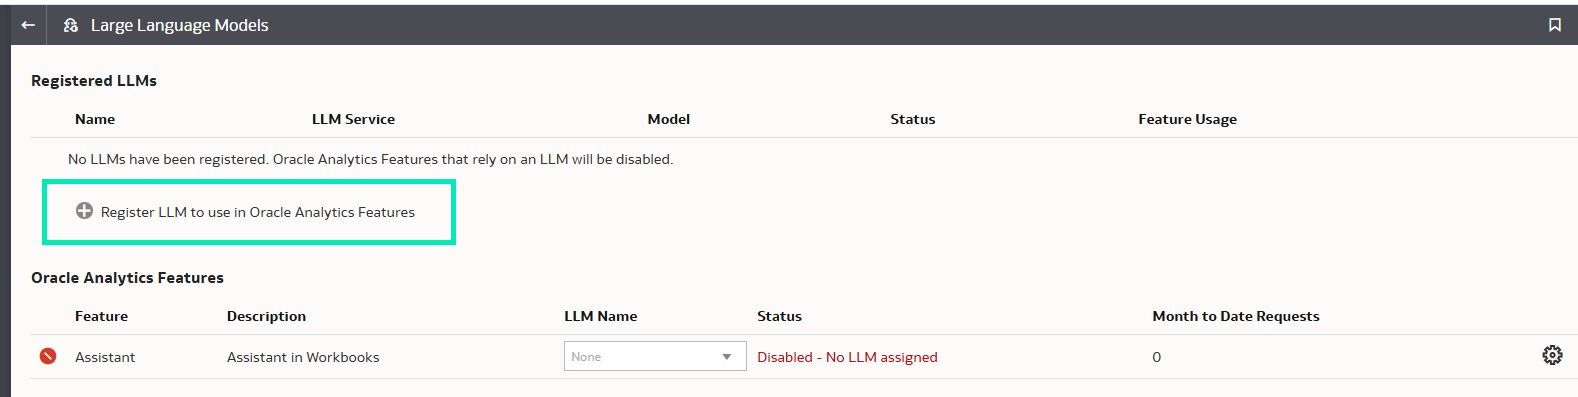
Figure 18: LLM Menu
Currently Oracle supports only two language models:
- Oracle Default
- GPT-4-Turbo (OpenAI)
To identify yourself with the third-party LLM, you’ll need an API key, which serves as a unique identifier:
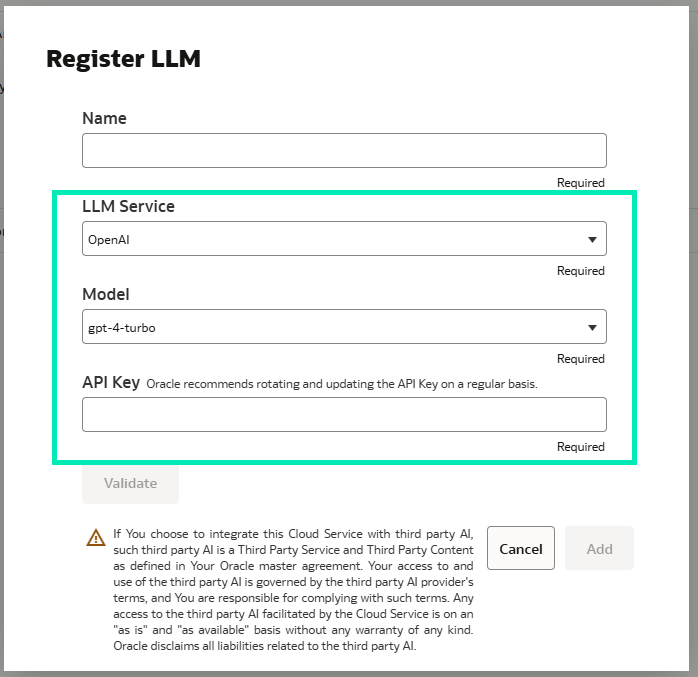
Figure 19: LLM Setup
The ability to integrate third-party LLMs with Oracle’s AI Assistant is a step forward in offering users the flexibility to select their preferred models. What’s more, it indicates Oracle’s commitment to expanding the range of supported LLMs in future updates, letting the user choose the model that best aligns with their data and analytical needs.
Conclusion
This latest OAC update has introduced a wide range of enhancements and new features, from simple user experience improvements like custom images for URL items and sorting options for calculated fields, to more advanced capabilities such as gauge chart visualisations and third-party LLM integration within the AI Assistant, meaning more tailored insights from your data.
These updates make Oracle Analytics an even more powerful tool for data exploration and decision-making. The next update is scheduled for May, so stay tuned!
Here at ClearPeaks we are dedicated to helping you make the most of the latest OAC features. Reach out to us today to enhance your data analysis and to convert your insights into impactful visualisations!