15 Abr 2024 Exploring the Latest Features and Enhancements in Oracle Analytics Server 2024
Oracle Analytics has presented the latest edition of Oracle Analytics Server (OAS) 2024, a significant advancement in their analytics offering. It’s worth noting that several features included in this release have been available to Oracle Analytics Cloud (OAC) users for over a year. OAC, being a cloud-based service, benefits from regular updates, whereas OAS, a solution tailored for on-premises deployment, only gets updated once a year, and OAS users have to install these updates into their infrastructure manually. This shows how important it is for OAS users to keep up with new releases and to plan their updates accordingly, so that they can access the newest features and enhancements.
It is always good to see Oracle rolling out an update, providing us with fresh ways to improve our daily work whilst also enhancing data analysis and decision-making in our sector. Here at ClearPeaks we have been following the release schedules from Oracle Analytics for both OAC and OAS, and in this article we’ll highlight the similarities and differences between the two offerings.
On-premises users can check out these references:
We’ve already explored and tested the most interesting features now available in OAS, and we’d like to share our insights with you!
1. Parameters
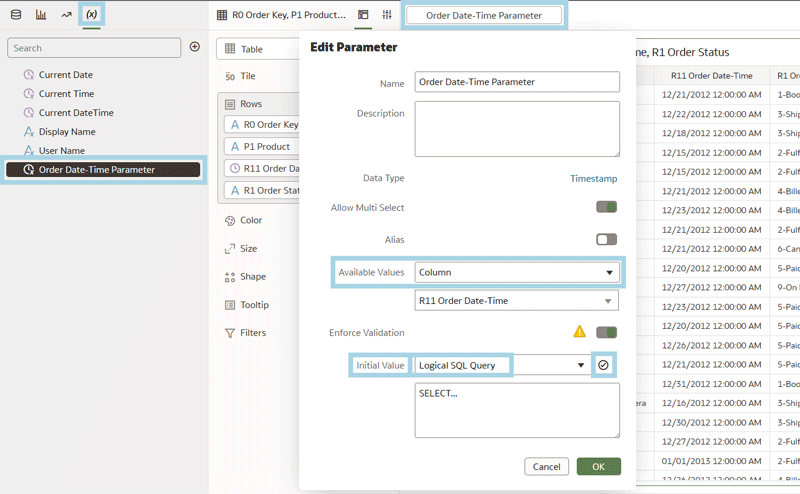
This new OAS release introduces a comprehensive suite of enhancements to the many parameters that had previously been released in OAC. Oracle had already included the ability to create and employ fixed parameters across a wide range of applications, subsequently enhancing them to allow changes to the initial value of a parameter. The introduction of an SQL validation button facilitates dynamic data retrieval based on specific criteria by checking the query’s correctness. Binding a parameter to list filters, selecting a data column for parameter values, controlling the validation of parameter values in workbooks, and binding parameters to relative time filters all ensure that the parameter value matches one of the available options. User-defined calculation in parameter generation enables custom calculations for generating parameters.
2. Conditional Formatting
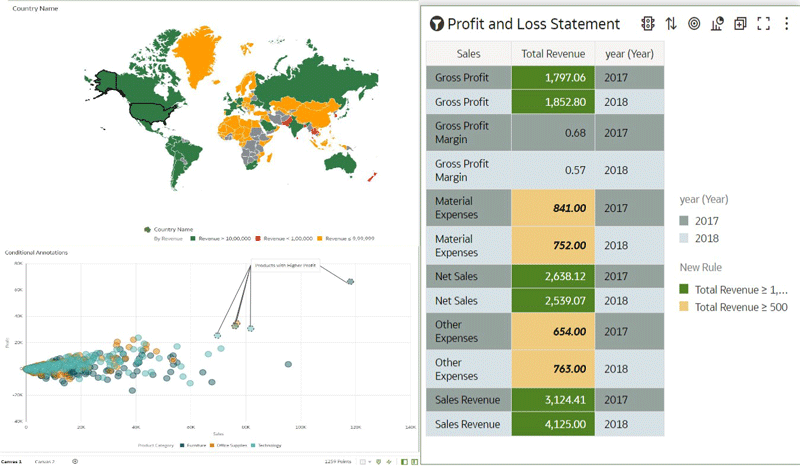
Conditional formatting is a feature that helps with the visual analysis of data, allowing users to set various rules on specific numerical values, measures, or matching text. It is a valuable tool for businesses, as it improves the visibility and interpretation of the data that we have highlighted for reasons such as relevance, outliers, or information requested by the client. Conditional formatting simplifies decision-making processes, thereby reducing time and effort compared to traditional methods.
Oracle Analytics has consistently enriched its conditional formatting capabilities with each update: over the past year, significant additions include features like Conditional Formatting and Rule Blending, enabling users to blend rules, with, for example, one rule to colour a cell and another to modify the font. Moreover, Conditional Formatting on Maps provides users with the ability to apply conditional formatting directly to geographical data visualisations, and the introduction of Conditional Formatting (rule-based) Annotations greatly enhances analytical capabilities by allowing users to annotate data based on specific formatting rules.
3. Improvements to Tile Visualisations
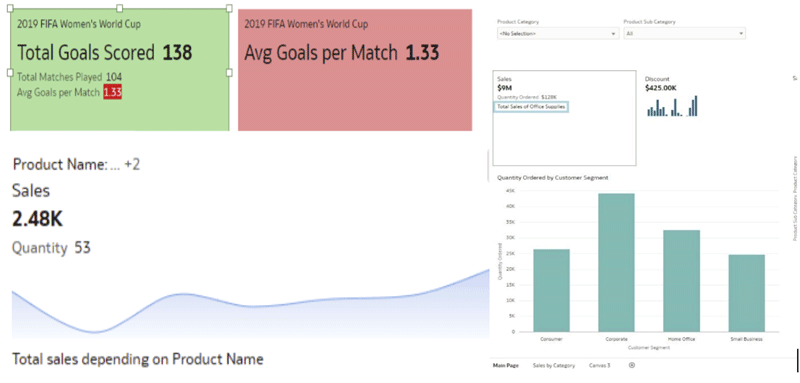
Tile visualisations are a dashboard and homepage feature to provide users with a quick overview of the most valuable information, offering a clear and effective way to analyse data by facilitating a visual understanding of trends and discrepancies. These visualisations can contain different types of information, such as numbers, text, images, or colours, depending on the dataset and the intended message.
Let’s explore the key updates to this feature in Oracle Analytics Cloud, as seen in the most recent Oracle Analytics Server release.
In the July 2023 release of OAC, Oracle introduced Spark charts to tile visualisations. Spark charts are compact visualisations that effectively present data trends or patterns in a condensed format, allowing users to select from various chart types, including line with area, bar chart, and area chart. Some other updates were Adding Description to Tiles, letting users add additional information or descriptions of the data, Creating Data Actions to make the tiles more interactive, and Improved Tile Visualisation.
4. Formatting Options
Over the last few months we’ve seen significant enhancements in the formatting options, so now let’s delve into the key updates to these in OAC that are now available in the latest OAS release.
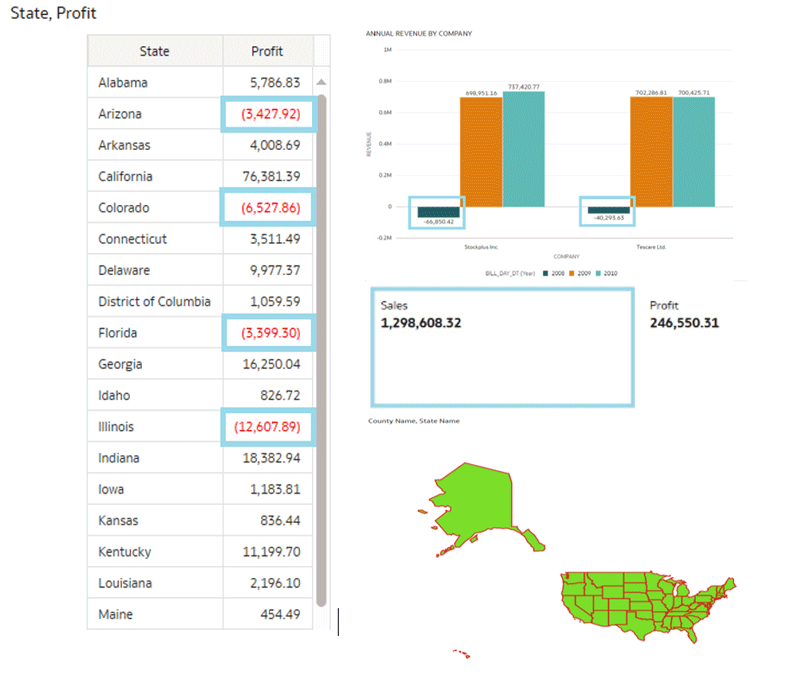
In the January 2024 OAC release map customisation was improved by the introduction of options to adjust region colours and line thickness. There was also a new default setting for region and border line styles, enhancing the potential for personalisation even further.
In the same release, formatting negative y-axis values greatly improved the visual interpretation of data. What’s more, in March 2024, further enhancements simplified the formatting of negative numbers in red. These improvements offer users immediate visual indicators, helping them to promptly identify areas of concern or deviations from anticipated values.
Some other updates added the ability to format large numbers and currency in reports by using abbreviations such as thousands (K), millions (M), billions (B), or trillions (T).
5. Print All Pages in Classic Dashboards
This edition of OAS boasts a new feature to print all dashboard pages as a PDF, whereas before we could only print one page within a dashboard. This feature allows the convenient physical presentation of data, especially useful when requested by the client.
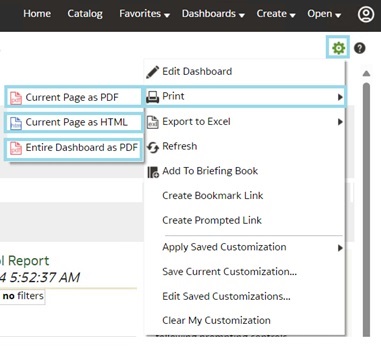
The first step is to open a dashboard and then to navigate to the top-right corner of the tab where you will find the Page Option button: click on it, then select the Print option. After clicking on Print there are three options to choose from, as shown in the screenshot below:
Select the new feature Entire Dashboard as PDF to download the entire dashboard in PDF format (before, only one page was possible).
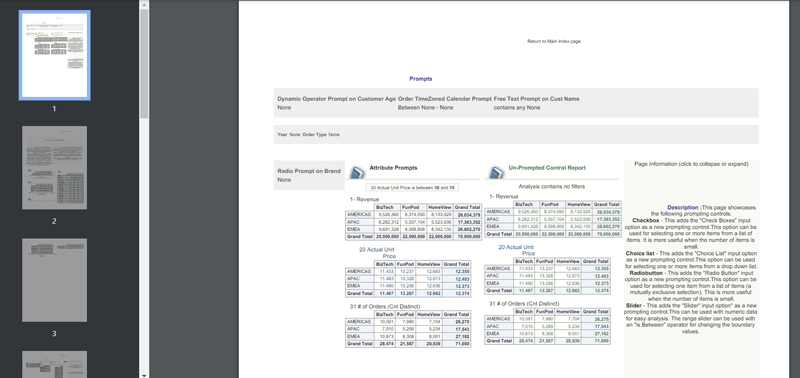
The screenshot below shows a sample PDF file downloaded from the OAS instance and on the left-hand side you can see the list of pages downloaded from the dashboard:
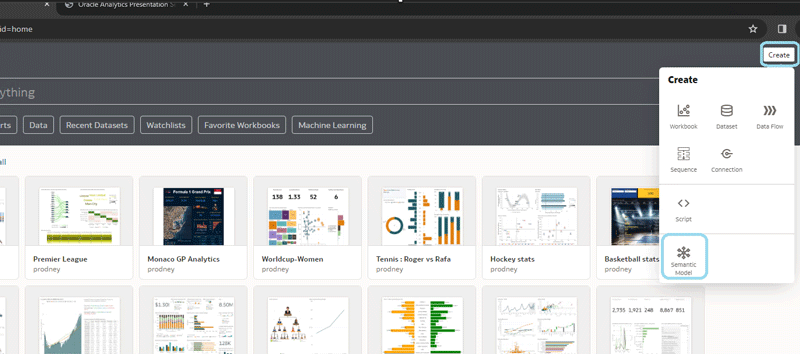
6. Semantic Modeler
With this OAS March 2024 release, we can now access one of Oracle’s most valuable features, the Semantic Modeler. This feature was fully implemented in the May 2023 update, with a preview available as of July 2022, and in the blog post we just referenced you’ll find a concise summary explaining the necessary steps for an effective implementation.
Today we’d like to emphasise the significance of this enhancement, as it directly affects work efficiency and consequently streamlines the process of updating environments. With the Semantic Modeler, multiple individuals can develop and apply changes to the desired environment without unnecessary delays. This development is undoubtedly great news for Oracle’s future!
Conclusion
This latest release really demonstrates Oracle’s commitment to its Oracle Analytics users, with many new features reflecting the company’s responsiveness to community feedback, as we can see in the new ability to print all the pages of a dashboard. The addition of the Semantic Modeler is sure to be well-received by many users too, and while some features may outshine others, this is still a substantial release packed with valuable functionalities that simplify reporting and diversify data manipulation.
The progression of OAS showcased in this release is another step in the right direction, matching or even exceeding competitors such as Power BI and Tableau. Each release unveils a new suite of innovative features that we’d expect from a modern BI reporting tool.
Here at ClearPeaks, our seasoned team of Oracle specialists remains at the forefront of new developments, continuously innovating on top of them. To keep up to date with Oracle’s latest products and our insights, or to discover the wide variety of technologies we work with, simply contact us and see what we can do for you and your organisation!

