04 Dec 2024 Exploring the Highlights from the Oracle Analytics Cloud November 2024 Update
Welcome back to our Oracle Analytics Cloud (OAC) blog series! In this edition, we’re excited to be diving into the highlights of the November 2024 update, which brings a range of powerful new features and enhancements. We’ll also explore an Oracle Analytics Gen AI feature that was released in September – the Oracle Analytics AI Assistant.
This release empowers users to fine-tune their analytics environments, organise resources more effectively, and leverage AI for deeper insights. In today’s post, we’ll cover some of the most exciting features, but if you want to check out all the changes in this release or previous ones, just click on this link.
Create and Share Workbook Canvas Templates
The November 2024 update introduces a convenient new feature for Workflow templates in OAC, designed to streamline and speed up dashboard creation. With Workflow templates, users can create, save, and share templates that serve as starting points for dashboards and reports, promoting consistency and collaboration across teams:
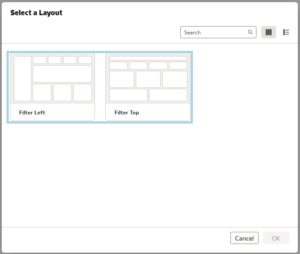
Figure 1: Select a Layout option
There are some ready-to-use layout templates that will populate the canvas with empty containers, ready for visualizations:
Figure 2: Avaliable Layout Templates
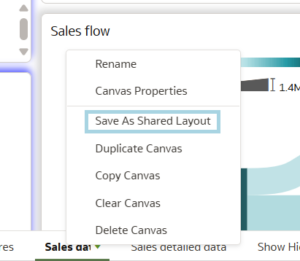
There’s also an option to save a custom template and share it with others, available by right-clicking on the desired canvas:
Figure 3: Saving a Custom Layout Template
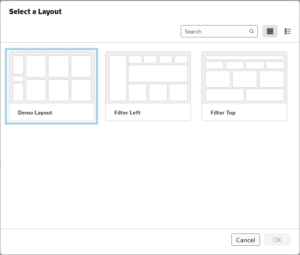
After saving a layout, it will be available to use whenever a new Workbook is created:
Figure 4: Updated list of available Templates
Advanced Design and Customisation
The November 2024 update also offers a wealth of customisation features, enabling users to tailor their OAC environments to better fit their specific needs. Key enhancements include:
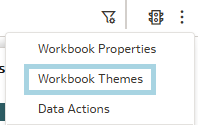
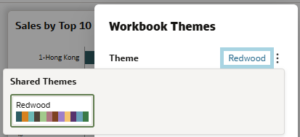
- Create and share Workbook themes: Shared themes can be easily applied to a Workbook by clicking on the Workbook Themes option in the menu and then selecting one of the Shared Themes.
Figure 5: Workbook Themes option
Figure 6: Selecting a Theme
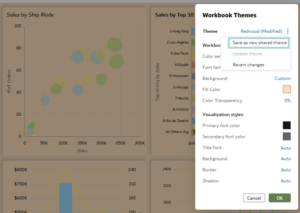
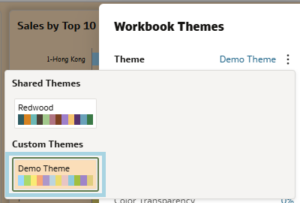
What’s more, we can also customise the styling properties from the Workbook and then save them as a new theme, available to select from the list:
Figure 7: Save as new shared theme
Figure 8: Updated Theme list
This feature, paired with the ability to create and share templates, enables companies to maintain consistent standards across dashboards. Regardless of the dataset used, users can select the company’s template and theme when creating a new Workbook.
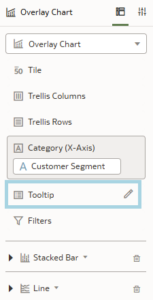
- Create custom tooltips in Workbooks: Custom tooltips can be created to provide additional context and formatted column descriptions for dashboard users. To create a custom tooltip, just select a visualisation and then click on the Edit button in the Tooltip section:
Figure 9: Tooltip Section
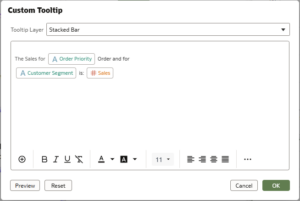
The Custom Tooltip window will appear, allowing us to customise the text, tags, and columns displayed in the tooltip. Additionally, we can modify styling options, such as font and colour:
Figure 10: Custom Tooltip window
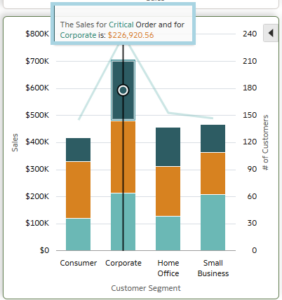
Figure 11: Tooltip shown in visualisation
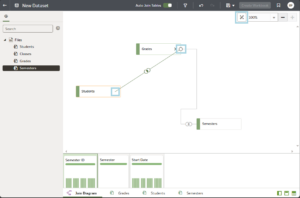
- Design datasets more easily: While creating a dataset, OAC allows for automatic joins when inserting a table into the editor. If column names do not match, we can manually create a join by dragging the small circle on the right side of a node and dropping it onto another node to establish the connection.
Additionally, we can now reposition nodes as we wish. There is also a button in the top-right corner to arrange the layout automatically:
Figure 12: Drag and Drop joins and layout modification
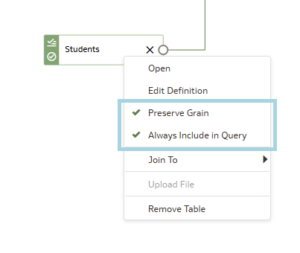
New options have also been added to the nodes: Preserve Grain and Always Include in Query. These options can be enabled or disabled by right-clicking on a node. The first option allows us to maintain a table’s level of detail, even after it has been joined with another table, whereas the second option ensures a table is included in a query even if it is not directly referenced in the visualisation. For instance, this is useful when applying a filter from a table that is not otherwise used:
Figure 13: New options for nodes
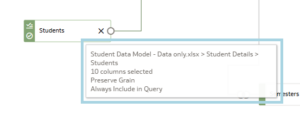
Upon hovering over a node, we can see some basic details about it without opening it:
Figure 14: Tooltip
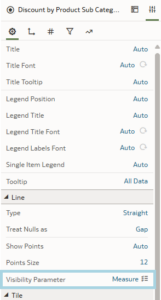
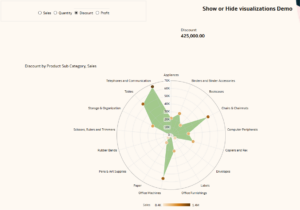
- Use parameters to show or hide a visualisation: Visualisations can now be dynamically configured to appear or disappear on the canvas based on the value of a parameter. This feature facilitates adaptable design and offers a more interactive dashboard experience for users. To implement this functionality, we need to select the desired visualisation and then choose the parameter that will control its visibility from the Visibility Parameter section:
Figure 15: Visibility Parameter section
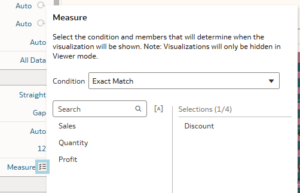
Then we click on the Settings button next to it for a list of all possible values, and select the parameter value to determine when the visualization becomes visible:
Figure 16: Visibility configuration
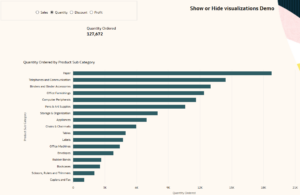
If the Workbook includes a filter selector linked to the parameter, we can now adjust its value to observe how the visualisations respond dynamically:
Figure 17: Different visualisations based on parameter
Figure 18: Different visualisations based on parameter
Share a Workbook URL with Persisted Filter Values
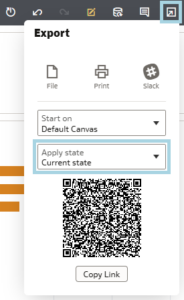
Another useful feature included in this update is the ability to export a Workbook in its current state, preserving all filter values for when it is reopened. This can be done easily, simply by selecting Current state as the Apply state when we export the Workbook:
Figure 19: Exporting Workbook with Current state
If done correctly, loading the workbook using the generated link will retain the same filter values as when it was exported.
Enhanced Navigation
As part of the November 2024 update, navigation and management of the OAC Catalog has also been optimised with the following features:
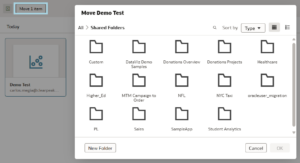
- Manage the content catalog more easily: We can now move any number of elements in the Catalog to a different location. To do so, click on the Move items button after selecting the desired elements and then choose the new destination in the window that pops up:
Figure 20: Move elements using the Move item button
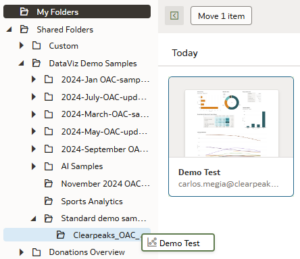
We can also drag and drop the selected elements directly into the destination location:
Figure 21: Move elements using drag and drop
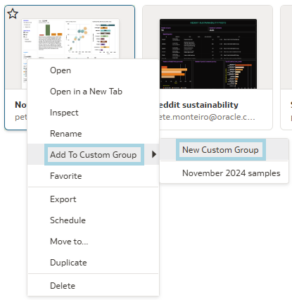
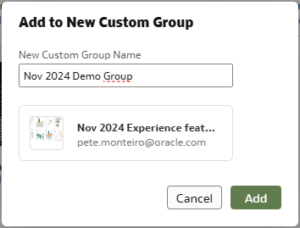
- Create custom groups of home page artifacts: This feature lets us create custom groups of multiple elements and access them from the Home page. To create a new group, we just right-click on any element we want to include in the group and select the Add to Custom Group option. Then, we choose New Custom Group and enter a name for the group:
Figure 22: Select the first element of the group
Figure 23: Create a new group
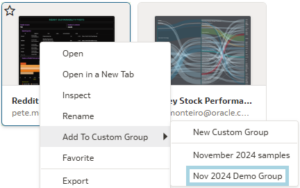
Now that the group has been created, we can right–click on any other element we want to include and in the Add to Custom Group option, select the new group:
Figure 24: Add element to a group
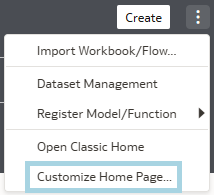
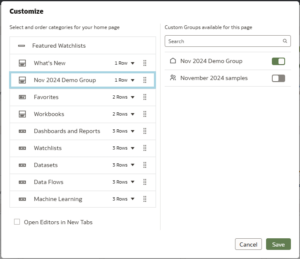
Once the group has been created and populated, we can use the Customize Home Page option in the menu to move it up or down our home page:
Figure 25: Customize Home Page option
Figure 26: Moving the group on the Home page
We can also share it with other users or roles by using the Access section after clicking on Inspect in the group menu:
Figure 27: Access section to share with other users
Administration Features
There are also some new features on the Administration side, primarily focused on managing permissions for the newly introduced actions and for scheduling the deployment of future updates:
- Grant permissions to analytics users at a finer granularity than previously possible: The new actions related to the creation, management, and sharing of groups, themes, and layouts offer greater flexibility to users when customising dashboards. However, managing the permissions associated with these actions is essential, and this can now be done via the Console menu:
Figure 28: Accessing the Layout & Themes permission menu
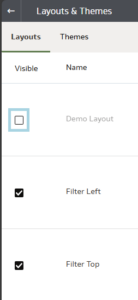
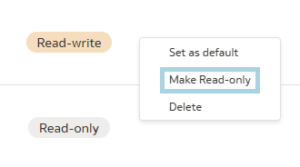
When we click on Layouts & Themes, we’ll see a list of all the current shared themes and layouts. From there, we can make any of them hidden to other users by unchecking the box in the Visible column. What’s more, we can change the permissions from Read-only to Read-write or vice versa by right-clicking on any of the elements:
Figure 29: Making an element non-visible
Figure 30: Changing the edition permissions for an element
- Select the preferred update cycle: OAC now offers the option to select a preferred software update cycle during instance creation. Users can choose between two cycles. Early means updates are delivered immediately after they become available, making this option particularly valuable for testing and development environments, offering the chance to explore new features before their official release. Regular means that the updates follow the standard release schedule.
Please note that the selected update cycle is locked once the instance is created. Switching to a different update schedule will require creating a new service instance and migrating existing content.
Connect to Remote Databricks Data Sources
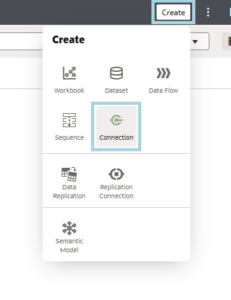
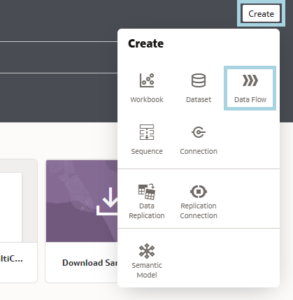
A new connection option for Databricks has been added to the list of possible data sources. To enable this functionality, the data source must have remote connectivity enabled, and the Data Gateway must be installed and configured on the user’s PC with the Databricks driver. Then we will be able to create the connection in OAC by navigating to the top-right menu and selecting Create > Connection:
Figure 31: Creating a connection
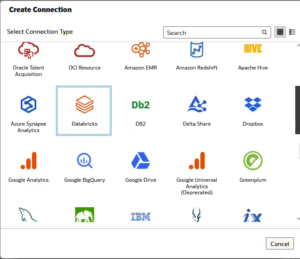
If everything’s been set up correctly, we’ll be able to see the Databricks option in the new window:
Figure 32: Choosing Databricks connection type from the list
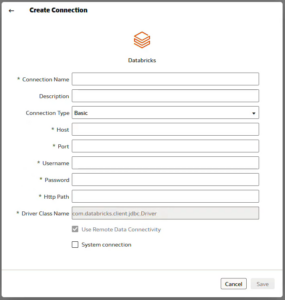
All the fields are ready to be filled in to create our new connection:
Figure 33: Connection information and Credentials window
After choosing the Advanced connection type, we will be able to use a Connection String field instead of the Host, Port, and Path fields. As we can see, the Use Remote Data Connectivity checkbox is uneditable, as this connection type does not support local data sources.
Deploy Custom Models for Document Classification and Key Value Extraction
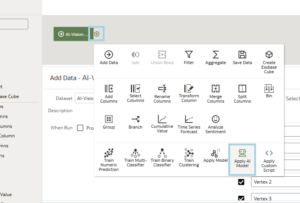
New methods have been added to the AI Models used in Flows. We can now deploy custom-trained models for Document Classification and Key Value Extraction. To use these features, integration with OCI Document Understanding in OAC must be enabled by the instance administrator:
Figure 34: Creating a new Flow
Figure 35: Apply AI Model to the Flow
These new models allow us to scan images for data and to insert it into a desired table format. This feature currently supports only English, with other languages hopefully coming soon.
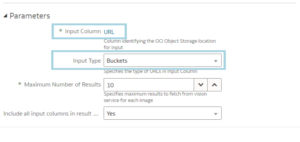
As parameters, we need to provide a column containing the images and specify the Input Type. If the documents are stored at a URL, the Input Type should be set to Buckets. Conversely, if we reference documents individually using a file location, the Input Type should be set to Documents:
Figure 36: Document scan parameters
AI Assistant
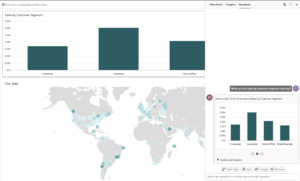
One of the most promising features recently introduced in OAC is the AI Assistant tool, allowing users to enter questions or commands in natural language during Workbook construction. The Assistant then generates appropriate visualisations based on the data.
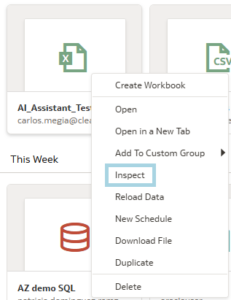
To enable the AI Assistant, we simply right-click on the dataset we want to use and select the Inspect option:
Figure 37: Inspect option
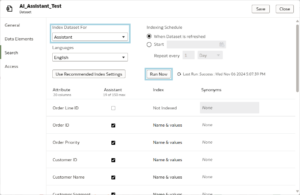
In the pop-up window, go to the Search section and select Assistant in the Index Dataset For option. A list of all the columns in the dataset will appear where we can configure settings such as deselecting columns that we don’t want the Assistant to consider, or assigning synonyms to columns to make our commands more intuitive. Once the configuration is complete, save the dataset and click on the Run Now button:
Figure 38: Enable Assistant and run AI model
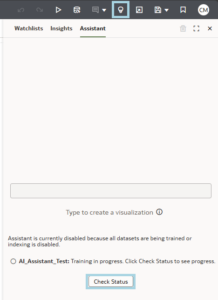
When creating a Workbook from the dataset, if we click on the Auto Insights button and go to the Assistant tab, we will see the dataset being trained. We can click on Check Status to refresh the process:
Figure 39: Assistant tab
Once the dataset has completed the training process, we can enter our questions and commands into the text box:
Figure 40: Assistant text box
The AI Assistant will generate multiple visualizations based on the question or command entered. We can select any of them and drag and drop it to the canvas:
Figure 41: Assistant results and generated visualisations
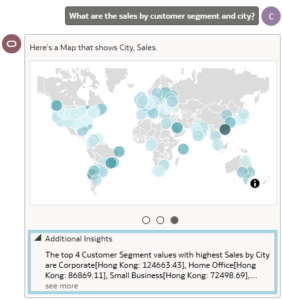
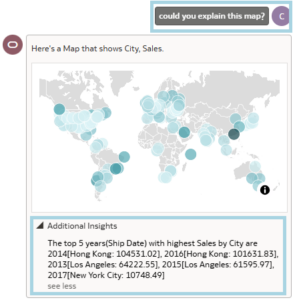
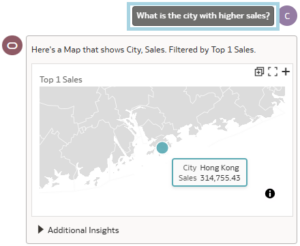
We can also click on the Additional Insights button to get more details about the visualisation, and even ask more specific questions about it:
Figure 42: Looking at Additional Insights about the generated visualization
Figure 43: Asking the Assistant for more details about a visualization
Figure 44: Asking the Assistant specific questions about a visualization
This new tool accelerates the process of developing Workbooks by providing users with new ideas and insights on how to represent their data, as well as allowing them to quickly populate a Workbook by simply dragging and dropping generated visualizations.
Conclusions
The Oracle Analytics Cloud November 2024 update introduces loads of features designed to personalise our analytics experience, streamline data modelling, organise content more efficiently, and enhance security and control. The AI Assistant, a feature first introduced in the September update, continues to revolutionise how users interact with their data. Harnessing the power of AI, we can automate complex tasks, generate actionable insights, and interact with data using natural language. The AI Assistant also enhances productivity by simplifying the creation of visualisations, uncovering hidden patterns, and enabling a deeper exploration of data.
With this update, we can create custom templates, themes, and tooltips to create dashboards tailored to specific needs, ensuring a more intuitive user experience. Data modelling is further simplified by enabling seamless connections to diverse data sources. Organising content is enhanced through the use of custom groups and improved navigation, whilst robust security and access controls empower us to manage who can view and edit our content.
These advancements solidify Oracle Analytics Cloud as an indispensable tool for analysing and visualising data. By enabling the extraction of valuable insights and fostering data-driven decision-making, this update elevates the potential of analytics for users across all industries.
Here at ClearPeaks, our team of Oracle experts is ready to help you to make the most of the newest OAC features. Whether it’s implementing advanced AI, customising dashboards, or optimising your data workflows, we’re here to support you on your journey, so reach out to us today!


