05 Jun 2024 End-To-End MLOps in Databricks
This blog post is part of a series that covers the development of an end-to-end Machine Learning Operations (MLOps) solution using various technologies or cloud platforms. In our previous blog post about end-to-end MLOps in Azure, we covered concepts such as using CI/CD for automating model testing and promotion, introduced MLflow, and also presented a use case with the Marketing Campaign dataset from Kaggle.
In this article, we’ll show you how to build an end-to-end MLOps pipeline with Databricks and GitHub Actions, using the same approach and data as in the previous blog post.
Why Databricks?
![]()
This is a recurrent question every tech adopter faces when considering which technology to use, and there are a lot of reasons for choosing Databricks:
- Unified platform: Databricks provides a unified analytics platform that integrates with major data sources, allowing data engineers, data scientists, and ML engineers to collaborate seamlessly in building, deploying, and managing ML models.
- Scalability: Databricks offers scalable infrastructure with distributed computing capabilities, which is crucial for handling large datasets and training complex ML models efficiently.
- Managed Spark environment: Databricks provides a managed Apache Spark environment, which simplifies the process of setting up, configuring, and maintaining Spark clusters for data processing and model training.
- Integration with MLflow: Databricks integrates flawlessly with MLflow, an open-source platform created by Databricks for managing the end-to-end ML lifecycle. MLflow provides tracking, experimentation, and model management capabilities, essential for implementing MLOps best practices.
- ML reusability: Databricks provides a Feature Store as a centralised repository, allowing data scientists to store and share features used for model training and inference, enabling discoverability and reusability.
- Collaboration and version control: Databricks provides collaboration features such as notebook sharing and version control, allowing teams to work together effectively and to track changes to code and models over time.
- Integration with other tools: Databricks also integrates with a wide range of tools and frameworks commonly used in the ML ecosystem, such as TensorFlow, PyTorch, scikit-learn, and more, making it both flexible and adaptable to different workflows and technologies.
- Automated ML (AutoML) capabilities: Databricks offers AutoML capabilities through tools like MLflow and automated feature engineering libraries, enabling data scientists to automate repetitive tasks and to accelerate the model development process.
- Security and compliance: Databricks boasts robust security features and compliance certifications, ensuring that sensitive data and models are protected and also meet regulatory requirements.
Overall, Databricks offers a comprehensive platform that effectively addresses the key challenges in deploying and managing ML models at scale, making it ideal for MLOps workflows.
Solution Overview
Now we’re going to present our solution to create a Databricks workflow that builds and develops an ML model using MLflow, leveraging the model training code discussed in our previous blog post. This MLOps CI/CD workflow involves the following steps:
1) Developing a model when a change is triggered in the GitHub repository that stores the model notebook, storing the newer model version in the Databricks Model Registry.
2) Performing data validations and evaluating performance metrics with the newer model.
3) Comparing the performance metrics of the new model with the production model, promoting the new model if it performs better.
In conjunction with this MLOps CI/CD pipeline, we will also monitor the data drift in our model using the Databricks Lakehouse Monitoring feature, which is in Preview at the time of writing.
The Databricks MLOps Pipeline
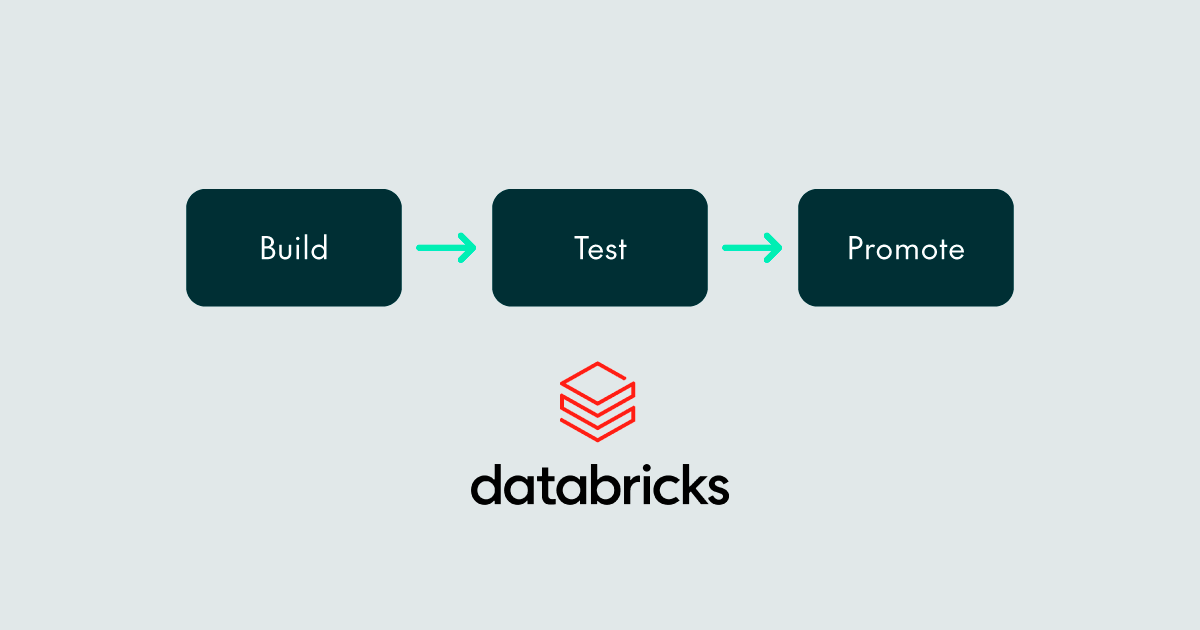
There are multiple approaches to implementing an MLOps pipeline, and although various approaches might be suitable for your use cases, we have designed and implemented one possible approach, for a single workspace environment, that encapsulates the three basic steps any MLOps pipeline needs: building, testing, and promoting a model.
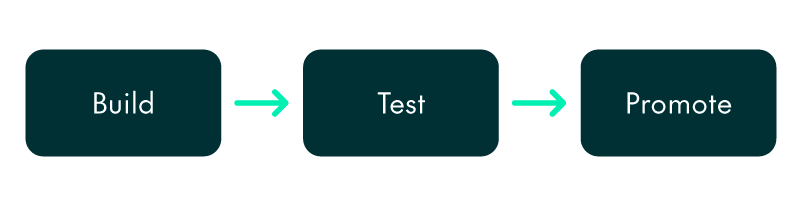
Figure 1: MLOps Pipeline Steps
These three steps are contained in different notebooks, as explained below, and correspond to the steps outlined in the solution overview:
- Build (create_model_version notebook): Reading raw data, applying preprocessing techniques for featurisation, storing the processed features to be used in the model training in the Feature Store, training the model, generating predictions with the trained model, and using MLflow to create a new model version in the Model Registry.
- Test (test_model notebook): Retrieving the new model with MLflow, comparing the input and output schemas with the expected schemas, and using the features from the Feature Store to generate predictions.
- Promote (promote_model notebook): Comparing the metrics (accuracy and F1 score) of the new model and the model in production, promoting the new model if it performs better.
We used Databricks Workflows and GitHub Actions to execute these three steps. Every time a push in the GitHub repository’s main branch or a PR is opened, a job run is created to execute these notebooks consecutively.
For the sake of simplicity, we use Databricks Repos to manually clone our GitHub repository into a folder in our workspace. This folder is referenced in the workflow to point each task to the corresponding notebook, so it is necessary to pull the corresponding branch (PR or main) in the Databricks Repo before running the workflow with the three tasks. To achieve this, our GitHub Action must download the Databricks CLI, update the Databricks Repo to the corresponding branch, and then create and run the job:
name: MLOps workflow

on:
  push:
    branches:
      - main
  pull_request:
    types: [opened, synchronize, reopened]
    branches:
      - main

jobs:
  build_and_deploy_job:
    if: github.ref == 'refs/heads/main' || github.event_name == 'pull_request'
    runs-on: ubuntu-latest
    name: Build and Deploy Job
    steps:
      - uses: actions/checkout@v4
        with:
          submodules: true
          lfs: false

      - name: Set up Databricks CLI
        uses: databricks/setup-cli@main

      - name: Checkout to repo in Databricks Workspace
        env:
          DATABRICKS_HOST: ${{ vars.DATABRICKS_HOST }}
          DATABRICKS_TOKEN: ${{ secrets.DATABRICKS_TOKEN }}
        run: |
          databricks repos update {your_repo_id} --branch ${{ github.head_ref || github.ref_name }}

      - name: Create Databricks MLOps job
        env:
          DATABRICKS_HOST: ${{ vars.DATABRICKS_HOST }}
          DATABRICKS_TOKEN: ${{ secrets.DATABRICKS_TOKEN }}
        run: |
          databricks jobs submit --json @job.json
Note that it is necessary to add the DATABRICKS_HOST variable and the DATABRICKS_TOKEN in the GitHub repository settings. The {your_repo_id} should also be replaced with the corresponding repository ID, which can be obtained using the Databricks CLI repos list command.
The workflow job run created is configured in a JSON. The job contains three notebook tasks with the corresponding dependencies and ACLs. In this example we are using an existing cluster, but we strongly recommend using job clusters as they are more economical:
{
  "tasks": [
    {
      "task_key": "create_model_version",
      "description": "Create a new model version with the corresponding changes",
      "timeout_seconds": 600,
      "notebook_task": {
        "notebook_path": "/Repos/Production/marketing/create_model_version ",
        "source":"WORKSPACE"
      },
      "depends_on": [],
      "existing_cluster_id": "{your_cluster_id}"
    },
    {
      "task_key": "test_model",
      "description": "Test new model version",
      "timeout_seconds": 120,
      "notebook_task": {
        "notebook_path": "/Repos/Production/marketing/test_model",
        "source":"WORKSPACE"
      },
      "depends_on": [
        {
          "task_key": "create_model_version"
        }
      ],
      "existing_cluster_id": "{your_cluster_id}",
      "run_if": "ALL_SUCCESS"
    },
    {
      "task_key": "promote_model",
      "description": "Promote model into Production stage if presents better results",
      "timeout_seconds": 120,
      "notebook_task": {
        "notebook_path": "/Repos/Production/marketing/promote_model",
        "source":"WORKSPACE"
      },
      "depends_on": [
        {
          "task_key": "test_model"
        }
      ],
      "existing_cluster_id": "{your_cluster_id}",
      "run_if": "ALL_SUCCESS"
    }
  ],
  "run_name": "Marketing Model MLOps",
  "access_control_list": [
    {
      "user_name": "info@clearpeaks.com",
      "permission_level": "IS_OWNER"
    }
  ]
}
The created workflow looks like this in the Databricks Workflows UI:
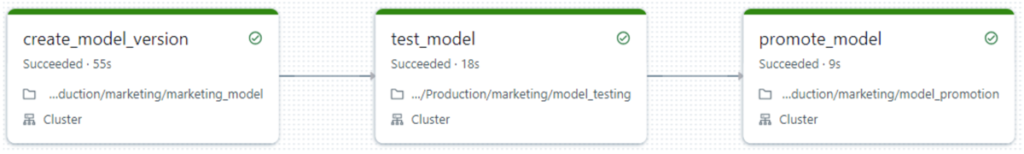
Figure 2: MLOps workflow for build, test & promote
With this pipeline in place, we can be sure that the best version of our model is going to be in Production, available for inference.
Feature Store
One Databricks capability that we have used in this demonstration is the Feature Store. Serving as a centralised repository, the Feature Store facilitates the storage and sharing of features for model training and inference.
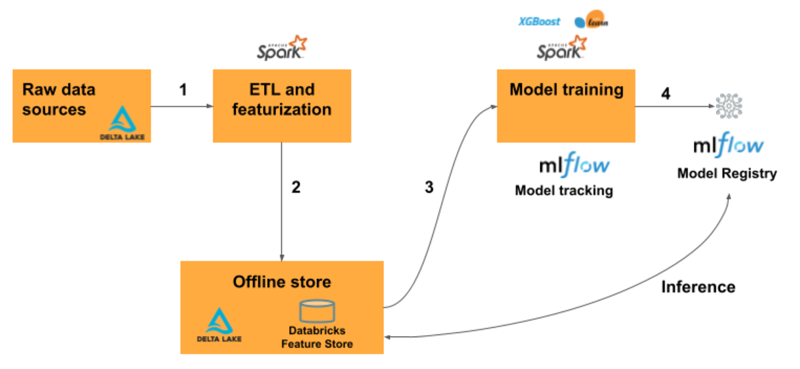
Figure 3: Databricks Feature Store
Before training our model, after all the featurisation has been carried out, we convert our pandas code to PySpark and use the FeatureStoreClient library to create the Delta table:
fs.create_table(
    name='feature_store.marketing_available_features',
    primary_keys='ID',
    df=df,
    description='Marketing available features'
)
Once our features have been stored, we can use the Feature Store in the training notebook for model development, and in the testing notebook to generate predictions with the new model version:
from databricks.feature_store import FeatureStoreClient

# Read data from Feature Store
fs = FeatureStoreClient()
df = fs.read_table(
  name='feature_store.marketing_available_features',
).toPandas()

predictions = pyfunc_model.predict(df)
predictions
With this approach, we are reusing the stored features in the testing phase without needing to pre-process any data again to perform our tests. Moreover, these features are available in the Machine Learning section of the Databricks UI, under the Features tab. This enables users to check all the stored features, their producers, metadata such as tags and created/modified dates, and the features’ schema. These features can also be published online to share and to monetise your data!
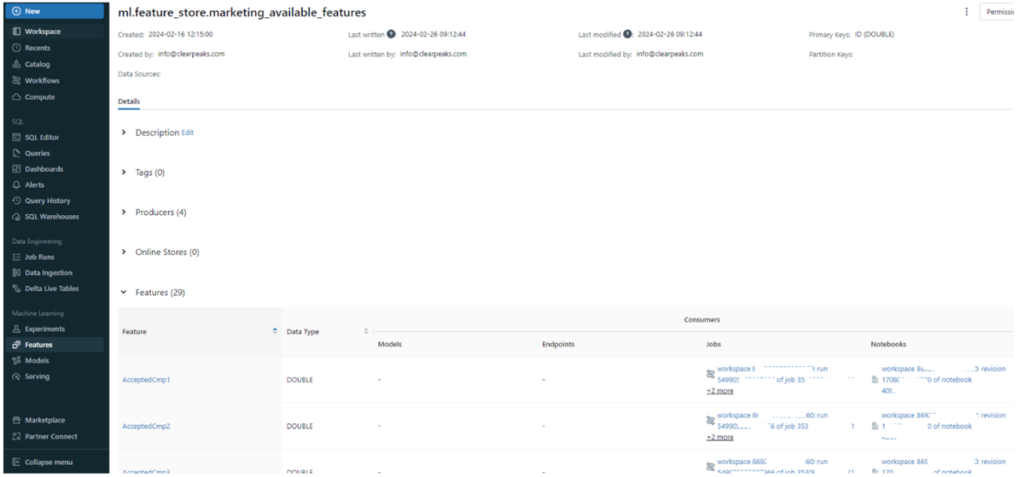
Figure 4: Feature Store UI
Drift Monitoring in Databricks
A crucial part of MLOps, besides automation for model deployment, is the monitoring of data drift and model performance drift over time to maintain prediction quality:
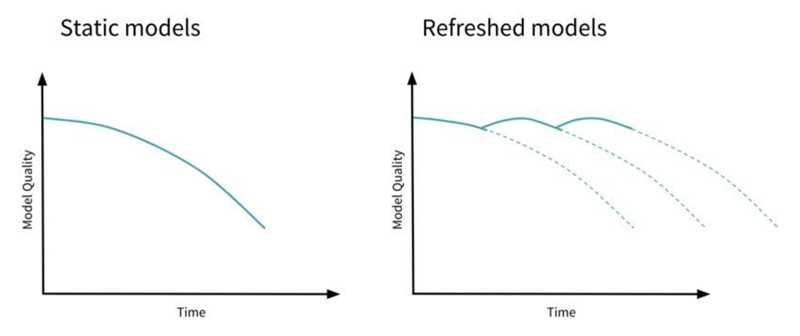
Figure 5: Databricks Drift Detection
Databricks provides a monitoring feature called Databricks Lakehouse Monitoring that allows you to check the statistics and quality of your data. It can be used both for data quality monitoring and for inference monitoring. This feature is in Preview at the time of writing, but we still wanted to share its potential with you!
In our case, we used another subset of the original dataset to perform some inferences with different versions of the model across various time windows. These inferences have been stored in a Delta Table, creating some additional columns such as:
– Prediction column, to store the inference result.
– Model ID column, to specify the model version used.
– Timestamp column, to record when the inference was made.
– Label column, to store the true value of the prediction, which is available in our case. This column is optional if the true value isn’t available (e.g., acquiring the true value can be challenging in models served online).
This is the code:
from databricks import lakehouse_monitoring as lm

monitor = lm.create_monitor(
    table_name=f"ml.inference.marketing_campaign_simulation",
    profile_type=lm.InferenceLog(
        problem_type="classification",  # We use a RandomForest
        prediction_col="predicted",
        model_id_col="model_version",
        label_col="Response",
        timestamp_col="ts",
        granularities=["1 day"],  # daily inferences
    ),
    output_schema_name=f"ml.inference"
)
Once executed, a background job is created to generate two tables to store the profile and drift metrics from the inference table. A dashboard is also generated automatically to visualise the information stored in the above tables. Here we can find information about model performance and statistics, data integrity, data drift (categorical and numerical), data profiles, and fairness and bias. What’s more, you can filter the visualisations by time range, slice value, inspection window, comparison models, granularity, slice key, and model ID. The visualisations in the Lakehouse Monitoring Dashboard can be grouped into two types: model performance drift and data drift.
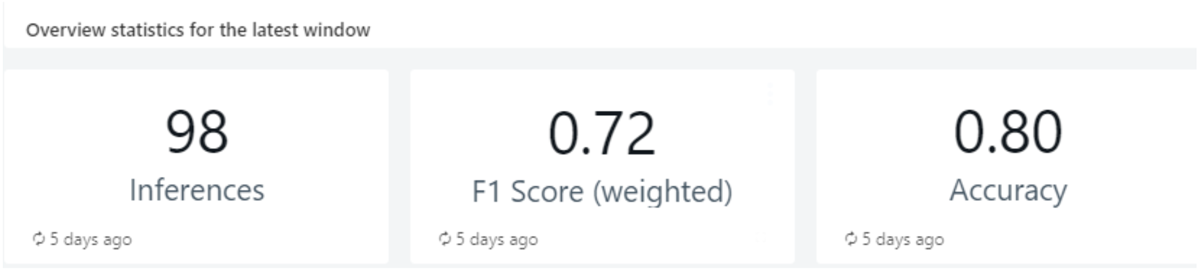
Figure 6: [Model Performance Drift] Model statistics in the latest window
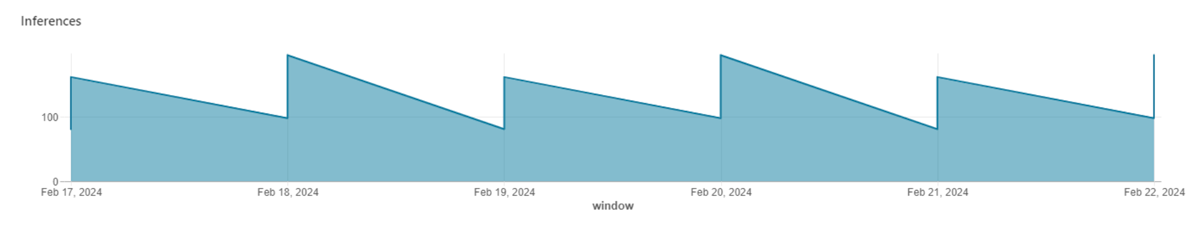
Figure 7: [Model Performance Drift] Inferences by date (inspection window)
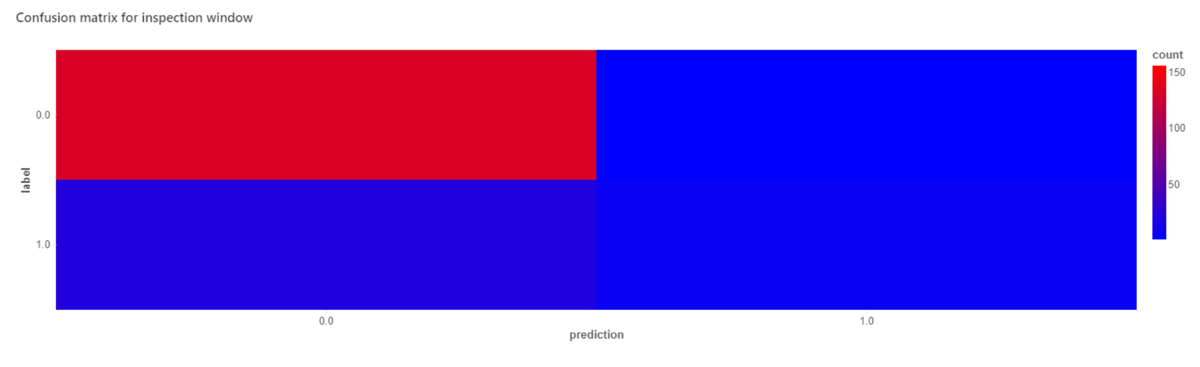
Figure 8: [Model Performance Drift] Confusion Matrix for inspection window
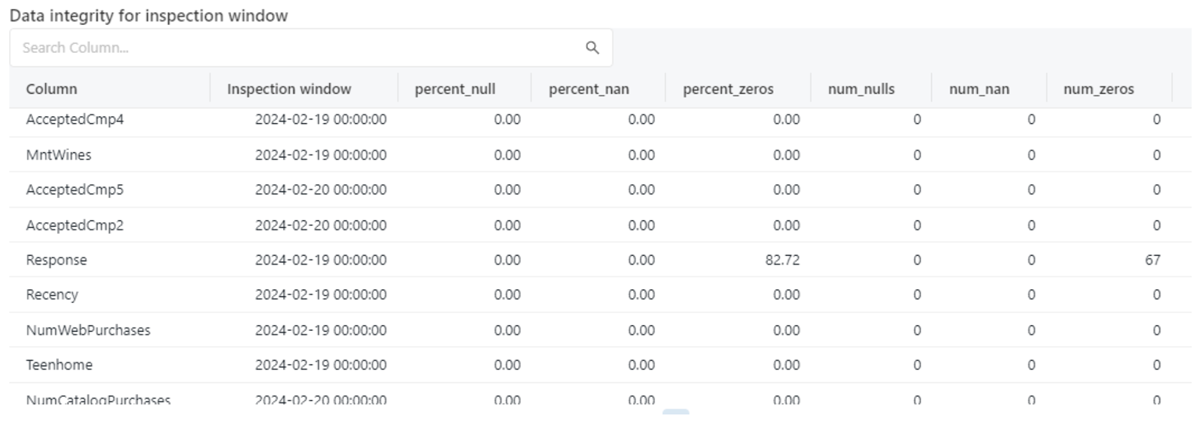
Figure 9: [Data Drift] Data Quality Checks with respect to nulls and zeroes in each column in the inspection window
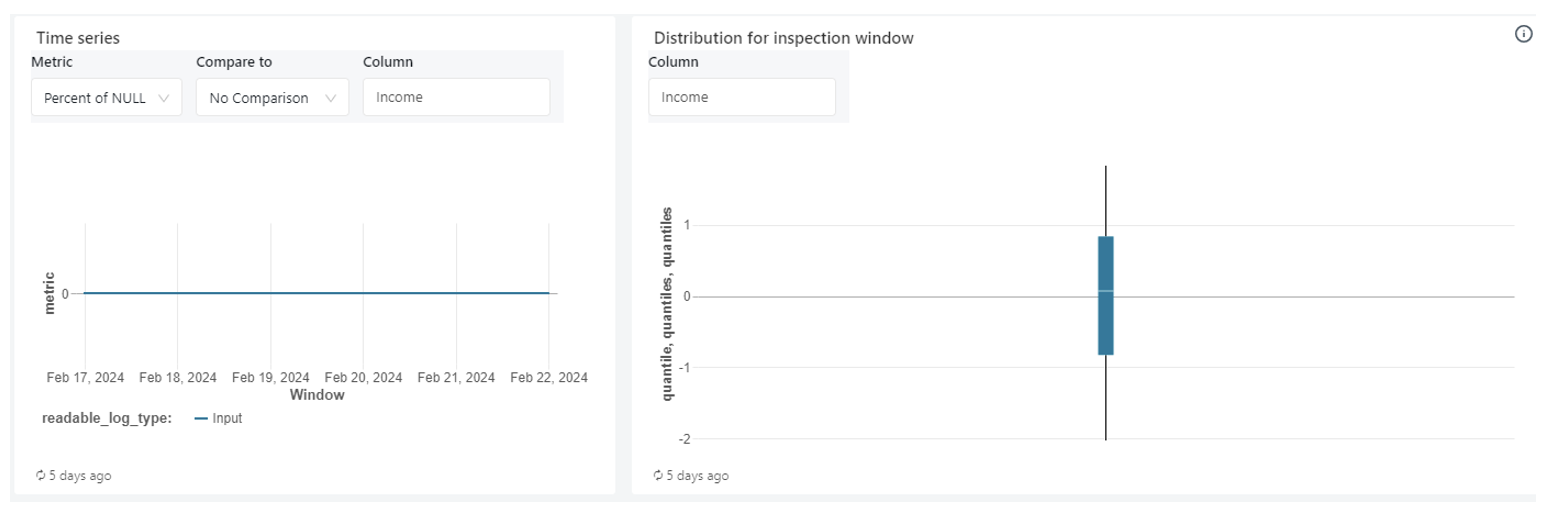
Figure 10: [Data Drift] Data Distribution (Line Chart, Box Plot) for Numeric Columns
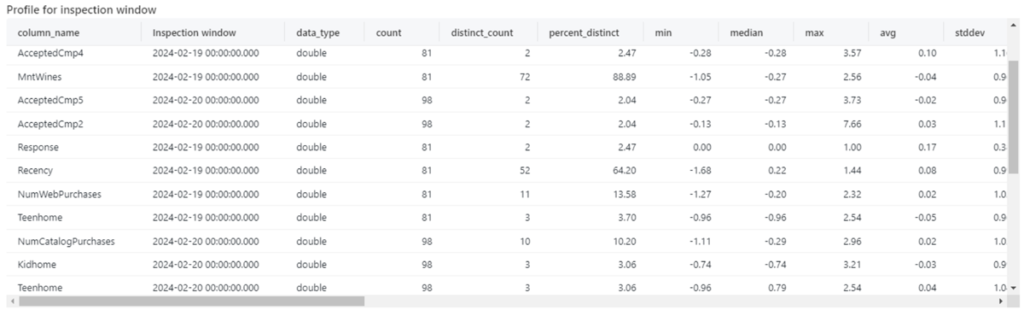
Figure 11: [Data Drift] Data profiling with summary statistics by inspection window
Bear in mind that we transformed a subset of the original data to perform these inferences, so the visualisations here might look a bit odd. Nevertheless, it’s easy to see the potential.
The Lakehouse Monitoring Dashboard enables the quick detection of shifts in our model metrics and in the inferred data. We can detect variations in data distribution with the data integrity and data profile visualisations, and we can use the model overview statistics to monitor our model performance over time. This drift monitoring process allows us to identify problems that might mean retraining the model.
Conclusions
Databricks is an exceptional product for developing your company’s ML use cases, applying MLOps best practices to productionise your model rollout strategy, thanks to the seamless MLflow integration with Databricks. Moreover, features such as the Feature Store and Lakehouse Monitoring take ML engineering to the next level.
If you are considering adopting Databricks or if you are thinking about how to leverage ML in your company, don’t hesitate to contact us. Our team of experts will be thrilled to assist you in unlocking the full potential of your data to achieve your business goals!