22 Jun 2022 Embed Power BI Reports into Your Web Applications Using Power BI Embedded Analytics
The Microsoft Power BI ecosystem contains a collection of services that allow us to create and visualise immersive dashboards containing data from diverse sources.
Power BI is gaining in popularity due to its ease of use and the functionalities that Microsoft adds to every release, allowing this platform to be used to meet many use cases, even beyond the visualisations themselves.
In this blog post we are going to focus on a specific functionality from Power BI: Power BI embedded analytics.
Power BI Embedded Analytics
Power BI embedded analytics allows the user to embed fully interactive Power BI reports and dashboards into a web application. This functionality is immensely powerful, as it opens the door to using the full capacity of a web application along with all the features that Power BI offers us.
What’s more, adding visualisations directly from Power BI to our applications speeds up the process and reduces expenditure, as customising these visualisations directly in the web application would have a higher implementation cost.
With Power BI embedded analytics, the user can easily create visualisations using the hundreds of visuals included or their own corporate themes, then embed them in a company portal, webpage, or application.
We use this powerful functionality in Observation Deck, a complete interactive solution we built for executives that combines the best of Power BI and custom web development. With Observation Deck, executives get all their important dashboards in a single, easy-to-use, and well-structured application.
Would you like to open a Power BI report using voice commands? Or highlight something and share it, just by touching the screen? These are some of the features implemented in Observation Deck through Power BI embedded analytics.
Let’s see how Power BI embedded analytics works.
Power BI Embedded Analytics Solutions
There are two types of Power BI embedded analytics solutions:
Embed for Your Customers
Also known as app owns data.
This kind of solution is used if the application we are developing needs to embed Power BI visualisations for external users.
The application will authenticate directly using our company authentication method, without interactive authentication, using a service principal or a master user to authenticate. These two authentication methods will not be explained in this blog article, but can be easily found in the Microsoft documentation.
Embed for Your Organisation
Also known as user owns data.
This type of application is used when the company wants to embed visualisations for its internal users.
The connected user will be able to see the visualisations they have access to, and data privacy will be ensured as row-level security will be handled directly by Power BI. The user must be authenticated in Azure Active Directory. If they are not logged in, a Microsoft login form will be shown before the user can see the embedded visualisations (Interactive authentication).
We are going to use this type of application in the example shown in this article.
Prerequisites
Power BI PRO account.
Azure Active Directory Tenant.
Azure Active Directory (AD) application.
The Azure AD application needs to have the following API permissions:
- Microsoft Graph:
- Read (To sign in).
- Power BI Service:
- Read.All (View all reports).
- (Optional) Dashboard.Read.All (If we want to embed dashboards from Power BI).
There is a registration tool to create the application automatically, with the options needed:
https://app.Power BI.com/embedsetup.
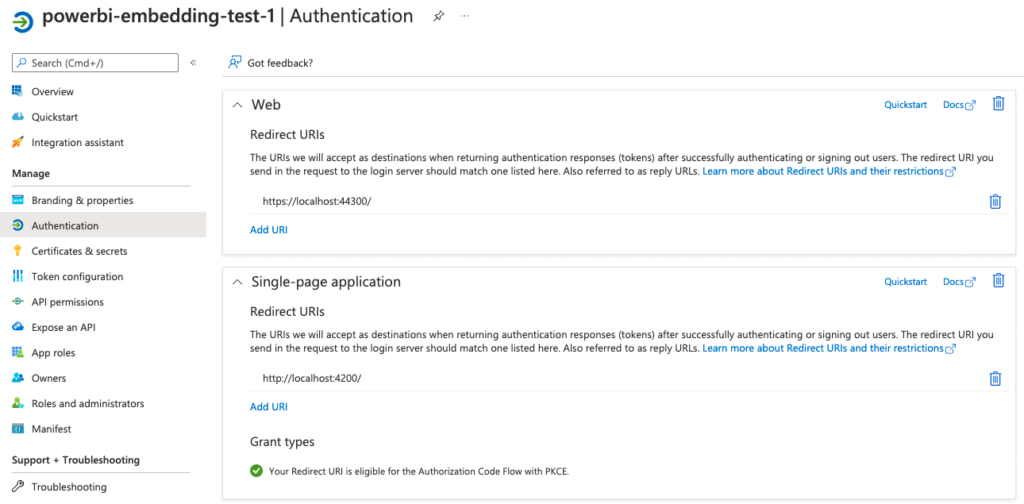
A redirect URI must be configured in Azure AD to be redirected after user authentication.
Embed for Your Organisation – Solution
Architecture Overview
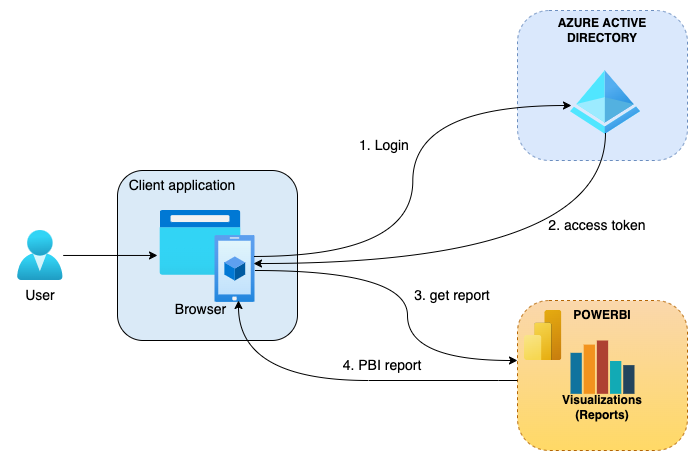
Embed for your organisation uses an interactive authentication flow; this means the user needs to be authenticated in Azure AD.
This is the flow to embed a Power BI report:
- The user enters the web application and if they are not logged in to Azure AD, they are asked to log in using their Power BI credentials.
- The user is authenticated, and Azure AD redirects the user to the web application, with the Azure AD token.
- The web application calls Power BI to get the visualisation needed, sending the previously generated token.
- Power BI returns the report and it is shown in the browser.
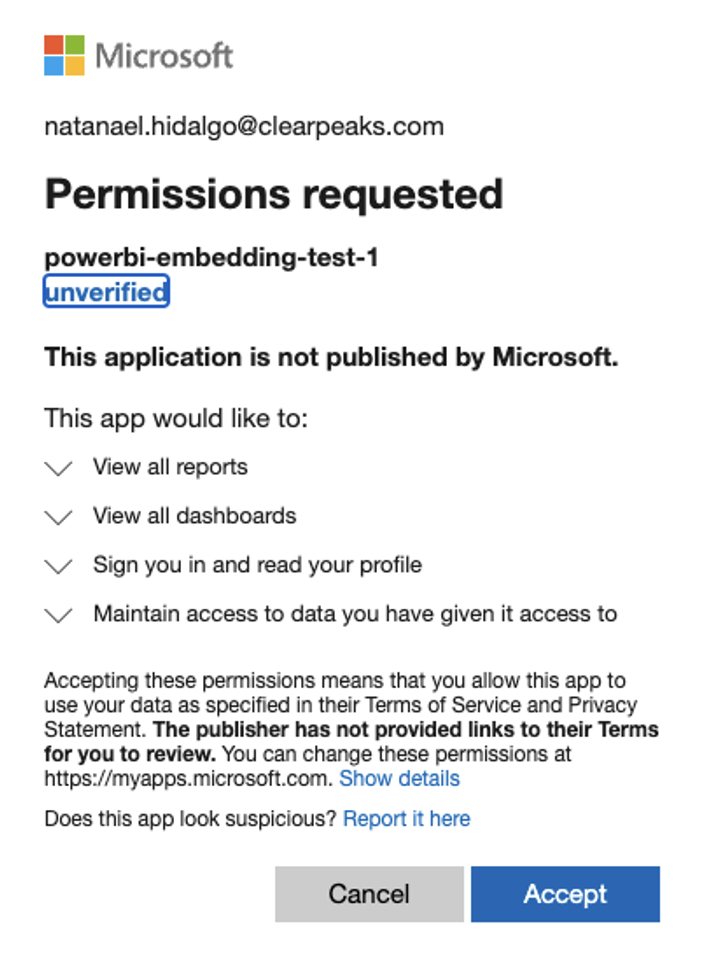
The first time the user logs in, the application will ask for permissions to log in and view reports (and all the permissions given to the previously created Azure AD application). A pop-up like the following will be shown:
Once accepted, the pop-up will not be shown anymore.
Microsoft Authentication Library for JavaScript (MSAL.js)
The first thing our application must do (steps 1 and 2 from the previous section) is to authenticate the user.
To perform the authentication, Microsoft provides the Microsoft Authentication Library for Javascript (MSAL.js). Using this library our application will be able to authenticate the connected user in Azure Active Directory, in order to receive the access token needed to interact with Power BI.
There are different versions of this library, so depending on the technology used in the frontend application we can download the corresponding version (at the time of writing there are Angular, React, and JavaScript versions).
How to use this library to perform the authentication is outside the scope of this blog post.
Power BI Client library
Microsoft provides a JavaScript Client library to interact directly with Power BI, the Power BI-client library. To use it in a JavaScript project, it must be installed directly from NPM:
npm install –-save Power BI-client
In .NET projects it can be installed with NuGet:
Install-Package Microsoft.Power BI.JavaScript
This library is needed to embed and interact with Power BI from a JavaScript application. Points 3 and 4 from the architecture overview section are performed using this library.
This library allows us not only to embed reports, but also to apply filters and slicers, to navigate through the different pages of a report, to show results from Q&A, to show only the visuals needed, amongst many other features.
Embed a Report into a Web Application
Using the Power BI Client library a report can be easily embedded into a web application, just using the embed method from the Power BI service provided by the library.
First we need a container in the HTML page where we are going to embed the report:
<div id="reportContainer"></div> |
Then we have to add some lines of JavaScript to embed the report into the div that acts as a container:
private embedPower BIReport(msalAccessToken: string, reportId: string) {
    const config = {
      type: 'report',
      permissions: pbi.models.Permissions.Read,
      tokenType: pbi.models.TokenType.Aad,
      accessToken: msalAccessToken,
      embedUrl: 'https://app.Power BI.com/reportEmbed',
      id: reportId,
    };
    const reportContainer = document.getElementById('embedContainer');
    this.report = this.pbiService.embed(reportContainer, config) as pbi.Report;
  }
|
Some configuration parameters must be set in order to see the visualisation correctly:
- type: ‘report’ – type of visualisation to embed.
- permissions (optional): permissions we give the user to interact with the report (in this case only Read).
- tokenType: the kind of token that gives the user access to the Power BI data we are embedding.
- In this case models.TokenType.Aad, the kind of token needed to embed for our organisation.
- accessToken: access token provided by the Microsoft Authentication Library (MSAL).
- embedUrl: URL of the report being embedded.
- id: ID of the report being embedded.
And that’s it! If everything has been configured properly, the report will be shown on the screen.
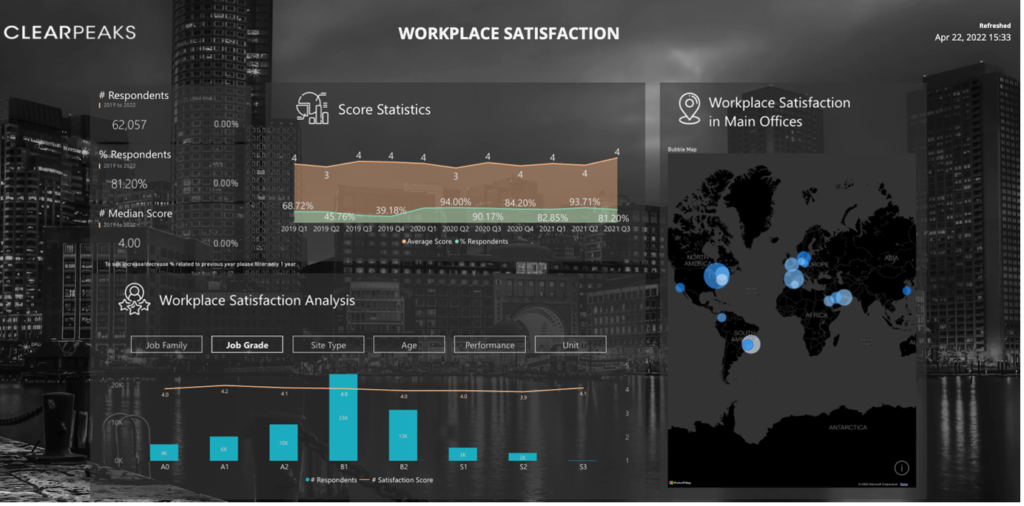
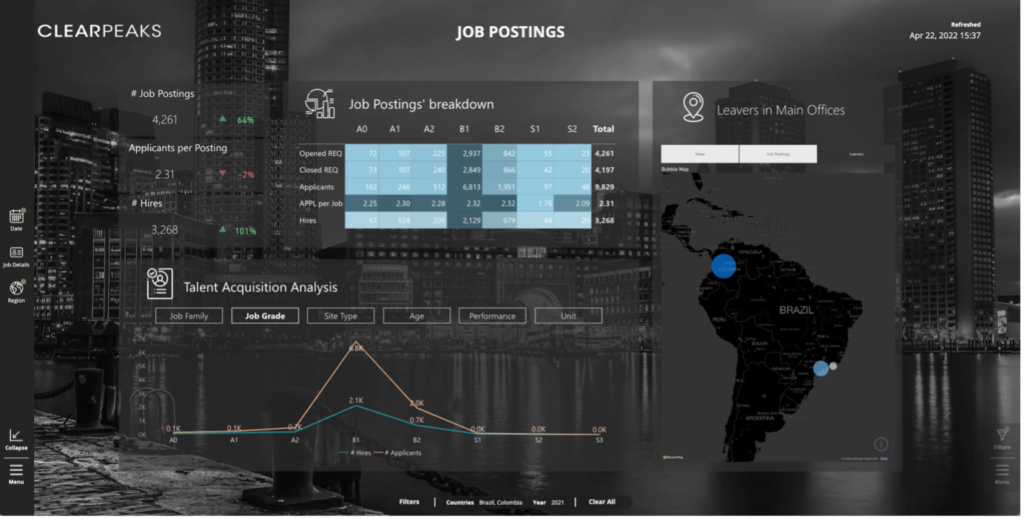
Here you can see some examples of Power BI reports embedded into our Observation Deck application:
Conclusion
These are some of the capabilities that Power BI embedded analytics offers, so stay tuned for the next blog posts where we are going to look at them in more detail!
And don’t forget to have a look at our Observation Deck solution, where we make use of all these wonderful capabilities.
Do you want to know more about Power BI embedded analytics? Are you wondering how to interact with your reports and filter them from your application? Or how to embed a report and dynamically add the theme that you want? Simply contact us and our team of certified experts will help you get the most out of your investment in Power BI and the rest of your Microsoft stack.

