02 Jun 2017 DATA QUALITY WITH INFORMATICA – PART 1: DATA PROFILING

1. Create a Data Profile
To start profiling our data, first open the browser, log into the Analyst tool (the default URL is http://infaServerName:8085/AnalystTool) and create a new project, which we’ll call Data_Profiling_Example :
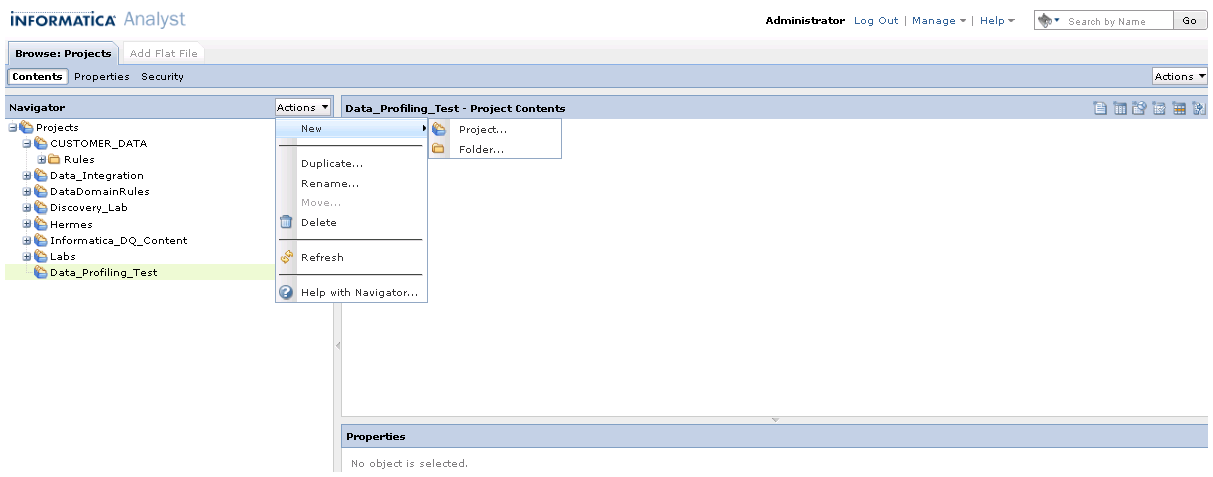 |
Figure 1: Creating a project in Informatica Analyst |
Now we add a data source; in this example we are going to load a file with information from AdWords. For demonstration purposes, several errors have been introduced into the file, like different date formats. To add a file, click on the actions menu on the right-hand side of the window and click add flat file:
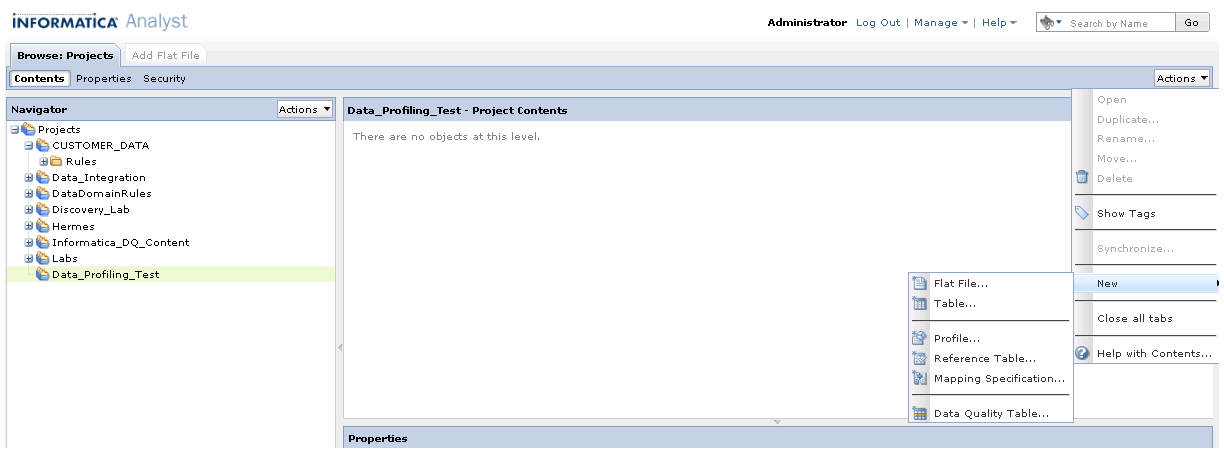 |
Figure 2: Adding data from a file in Informatica Analyst |
Importing data from files is straightforward if we follow the wizard. In this example, we are going to set comma separated values, header present, data starting in line 2, and all the columns will be strings. The tool will automatically detect the length of the fields.
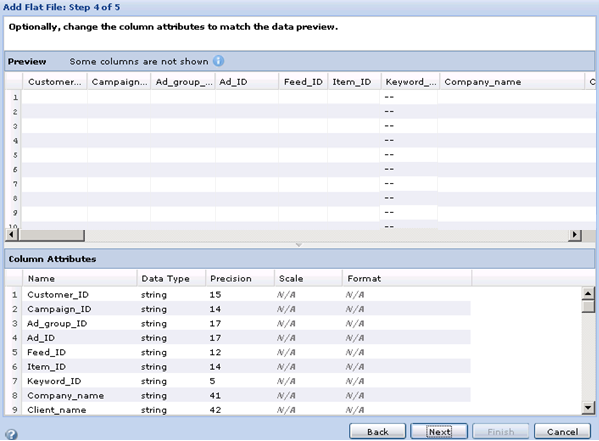 |
Figure 3: Add flat file wizard in Informatica Analyst |
Now we need to create a new profile for our data, and we can do this by clicking on new profile on the menu on the right. In the wizard, we select our data file and accept all the default values. Once the profile has been created we can review the values of the data, the percentage of nulls, and term frequencies in the results panel, as well as being able to analyse the patterns of the data values for every column. We can also view a summary of basic statistics, such as the max value, the min value and the top and bottom values for each column.
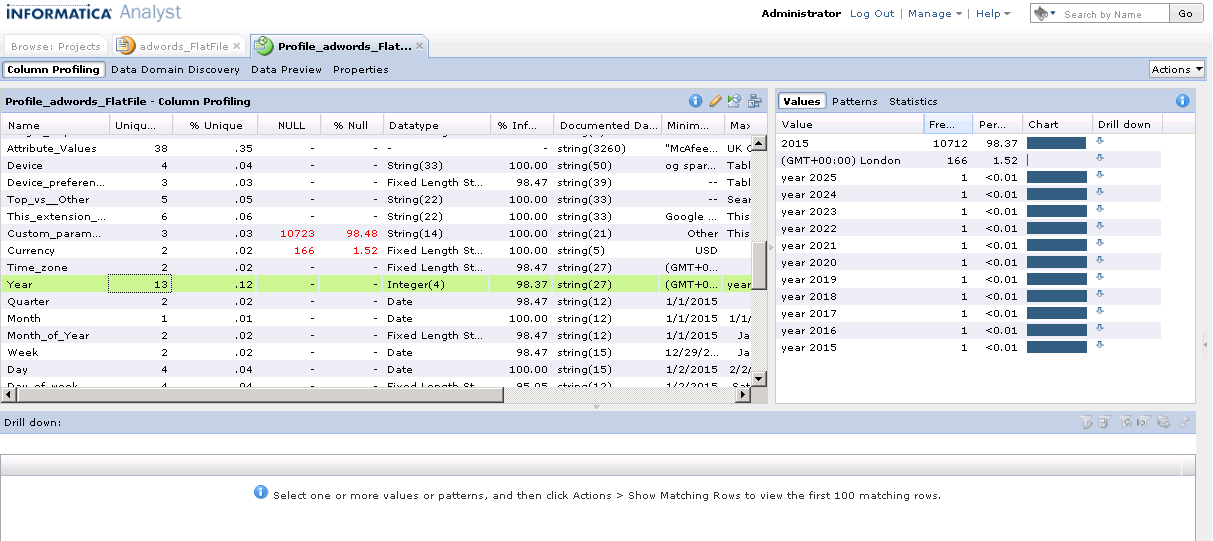 |
Figure 4: Profiling results in Informatica Analyst |
In our example we can see several issues in the data of the file. For example, in the image below we can see that the year is incorrect for some records (we are assuming that the file should contain just the numeric value for the year). In this example, the file should only contain data for 2nd January 2015, so it looks like the file has some invalid records, as there are some records with a different year, and others with a wrong value. This could be due to a bad extraction from the source system, or a wrong delimiter in some rows. In order to measure the quality of the file, we are now going to create some business rules, add them to the data profile, and finally create a visualization. The data analysts from our organization have given us the following business rules:
| • | the year must be 2015 for this file |
| • | the day column must always be 1/2/2015 |
| • | the file should only contain Enabled campaigns |
We will create two business rules to validate the year and the day columns, and for the Enabled campaigns we will set up the value Enabled in the campaign_status column as valid. We can create the business rules in two ways: by using the expression builder in the Analyst tool, or by creating a mapping using the Informatica Developer. To create the business rule directly in the profile we simply click on edit, then on the column profiling rules, and the on the plus sign to add a rule.
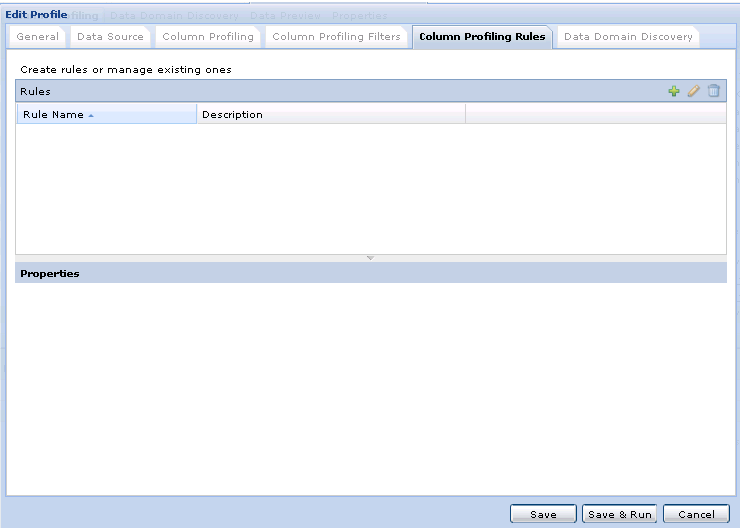 |
Figure 5: Creating rules in Informatica Analyst |
Then we select new rule for the year column and enter the expression you can see in the following image. We can save the rule as reusable; this way we will be able to apply exactly the same rule for a different column in the file if necessary.
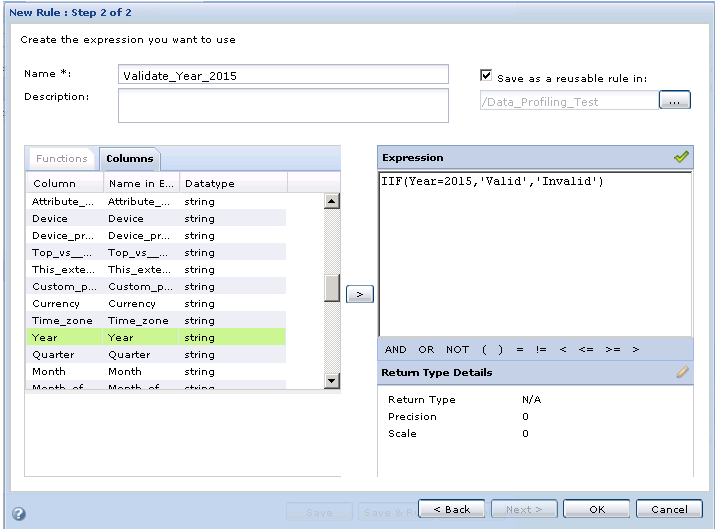 |
Figure 6: New rule wizard in Informatica Analyst |
We will implement the second rule in the Developer tool. To do this, we open Informatica Developer and connect to our project, then create a mapplet with an input transformation, an expression and an output transformation, and save it as DayValidator. To validate the rule, we can right-click on the rule and select validate.
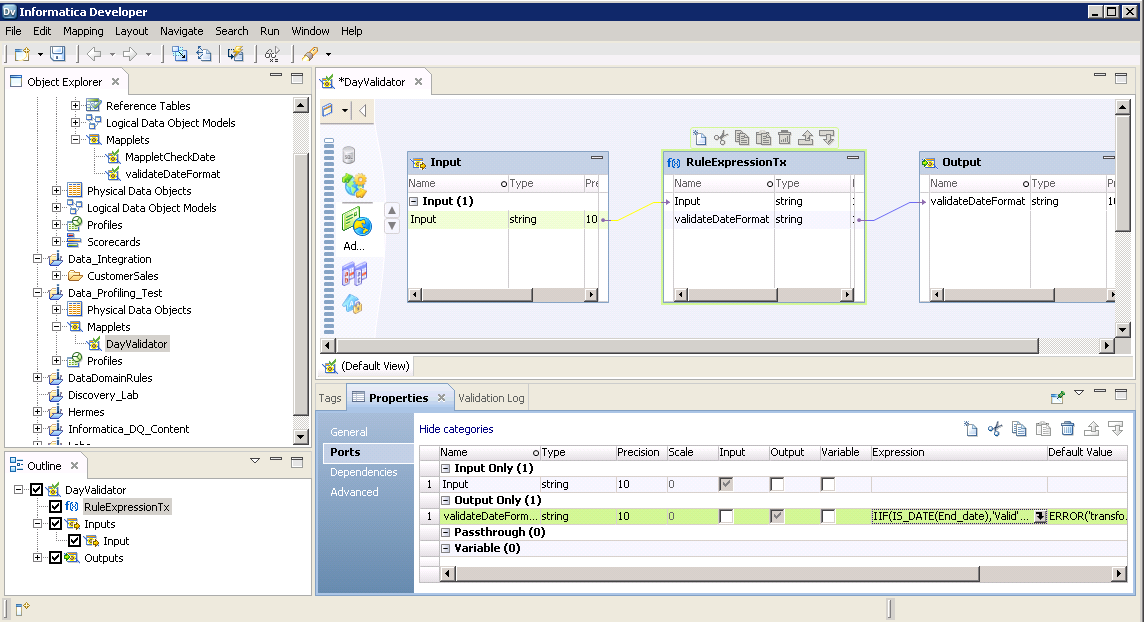 |
Figure 7: Creating a rule in Informatica Developer |
We will define the expression with three possible output values: not a date, Valid date and Invalid date.
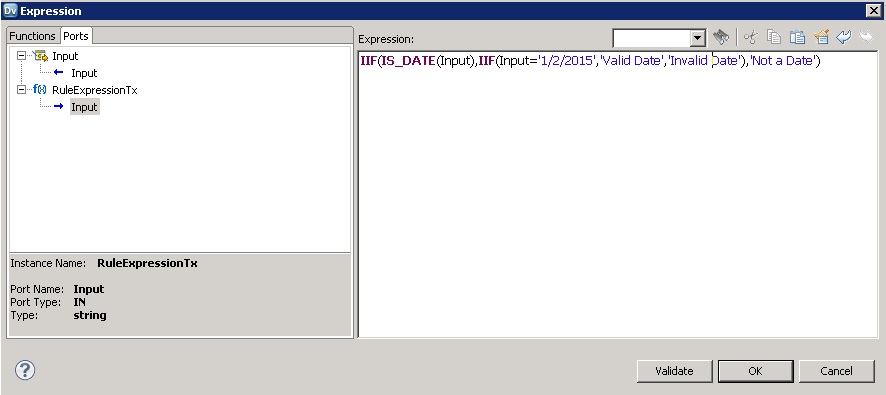 |
Figure 8: Defining rules in Informatica Developer |
Once the rule has been created, we can go back to Informatica Analyst, edit the profile and now, instead of creating a new rule, we are going to apply the DayValidator rule we just created in Developer to the day column in the profile. We will call the output of the rule IsValidDay:
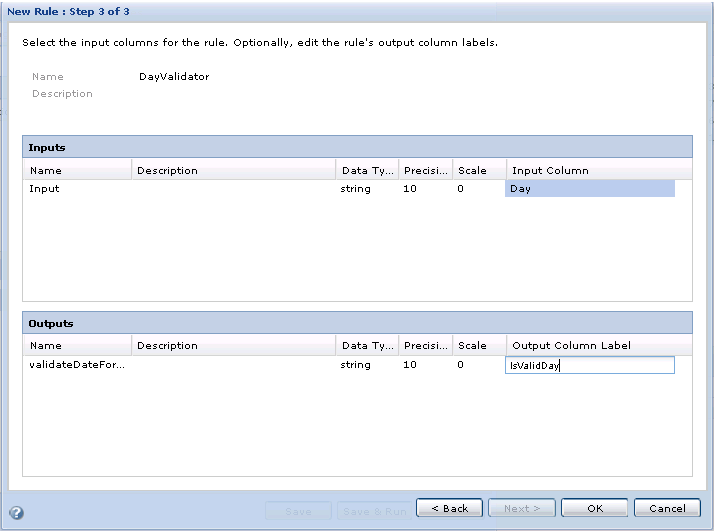 |
Figure 9: New rule wizard in Informatica Analyst |
Now we are ready to run the profile again and review the outcome of the two different rules:
 |
Figure 10: Data profiling project in Informatica Analyst |
Reviewing the results, we can see that the data contains wrong values for Day and Year:
 |
Figure 11: Reviewing profiling results in Informatica Analyst |
2. Create a Scorecard for the Profile
Now that we have executed and checked the profile, we can create a scorecard to measure the quality of the file as the last step in this data quality assessment. In order to do this, we have to go to the profile and add it to a new scorecard. We can define the valid values for each column in our data. In this example, we are going to create the scorecard with three metrics called scores (both outputs from the rules and the campaign status) and then select the valid values for each different score. The scorecard allows us to drill down from the score to the data. We select the key of the file (first three columns), the campaign status, and the output from both rules as drilldown columns; this way we can easily export the invalid rows to a file and send the results to the owner of the data so they can fix the wrong values and re-run the proper processes to update the data.
 |
Figure 12: Data profiling scorecard in Informatica Analyst |
This concludes the first article in this series about Data Quality with Informatica. In the next couple of blog posts we’re going to explain how to standardize and deduplicate data. Stay tuned! If you would like to know more about the Data Quality Services we offer click here!

