27 Feb 2025 Calculation Groups in Power BI
A common request from our customers is to compare current-year sales with those of the previous year. This often involves calculating the year-on-year (YoY) sales difference and the percentage growth across metrics such as units, values, and prices. The primary objective is to deliver a clear and precise analysis of these performance indicators, enabling better decision-making.
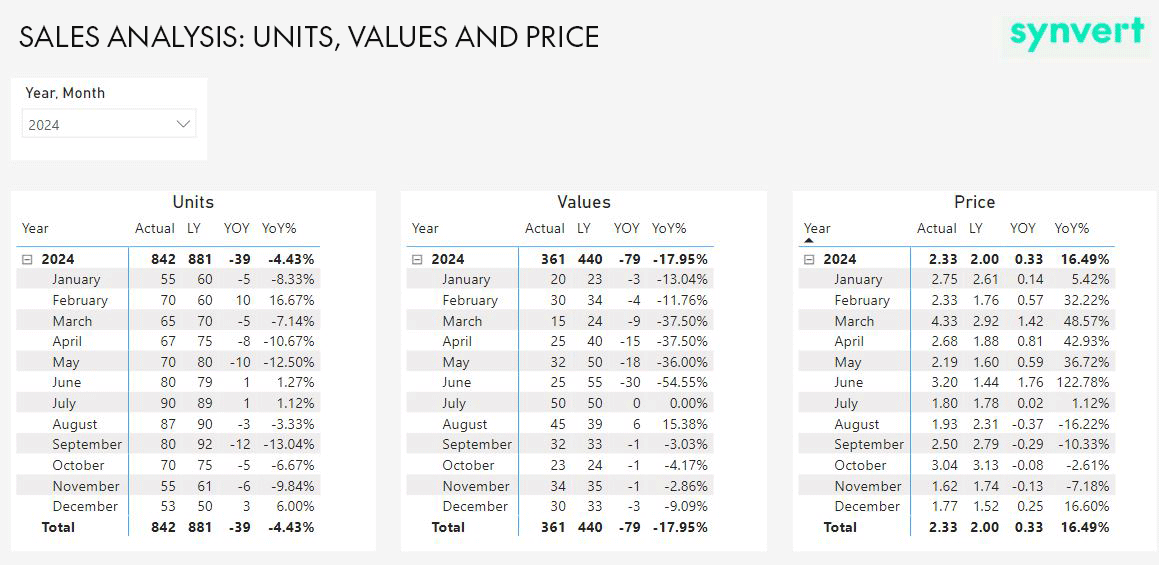
Figure 1: Key Indicators
Creating these measures involves repetitive logic. For example, when analysing sales units, you typically need four measures: current sales, previous year sales, year-on-year difference, and growth %. The same approach applies to sales values and prices.
But is it really necessary to create so many individual measures when the pattern is so consistent?
This is where the Calculation Groups feature of Power BI comes into play, reducing the number of required measures, optimising calculation time, and ensuring greater consistency across reports.
Traditionally, this functionality was only available in Tabular Editor, but it is now accessible directly in Power BI Desktop, which is the focus of this article.
How to use Calculation Groups in Power BI Desktop
Creating a Calculation Group
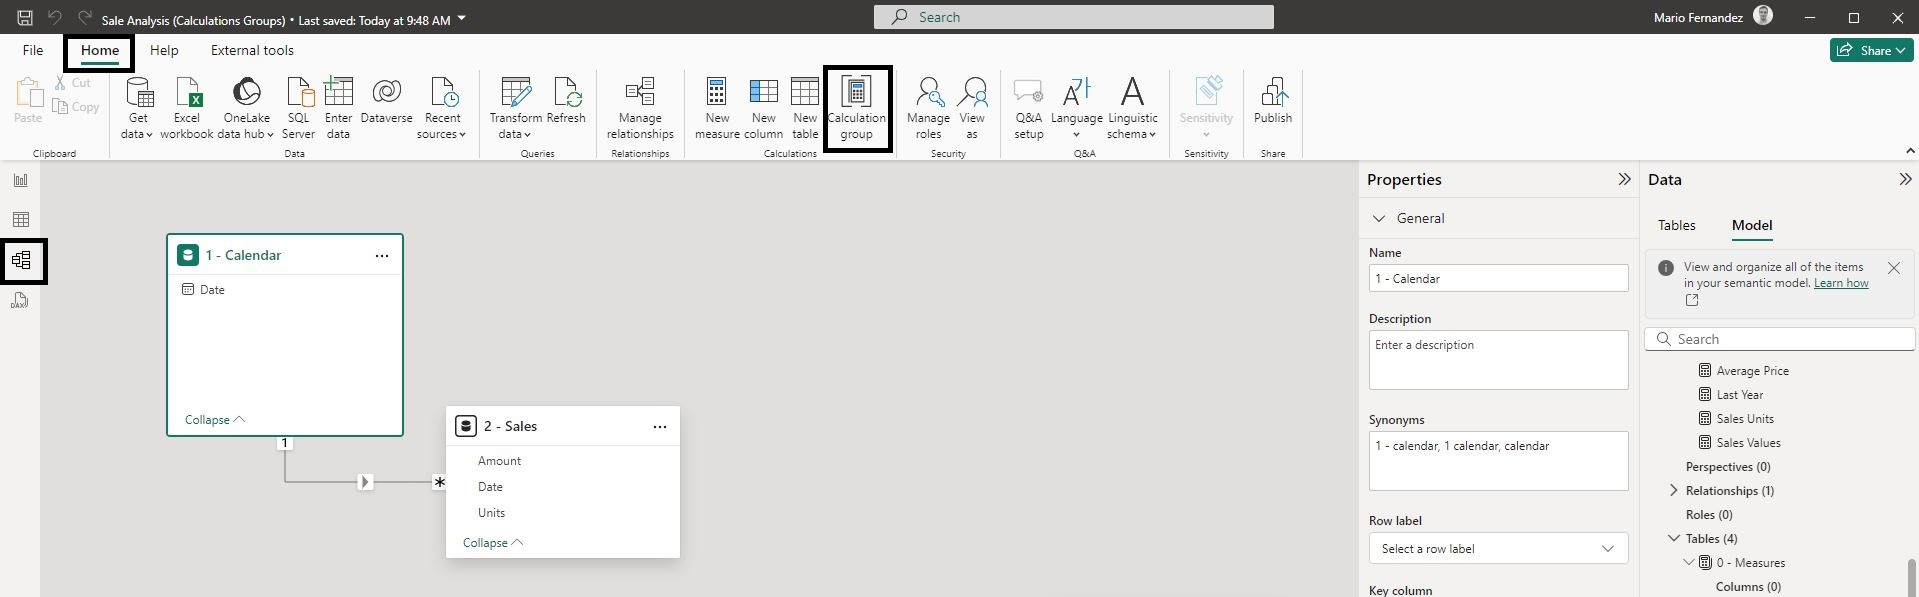
- Open Calculation Groups, then go to Model View – Home – Calculation Group.

Figure 2: Calculation Group
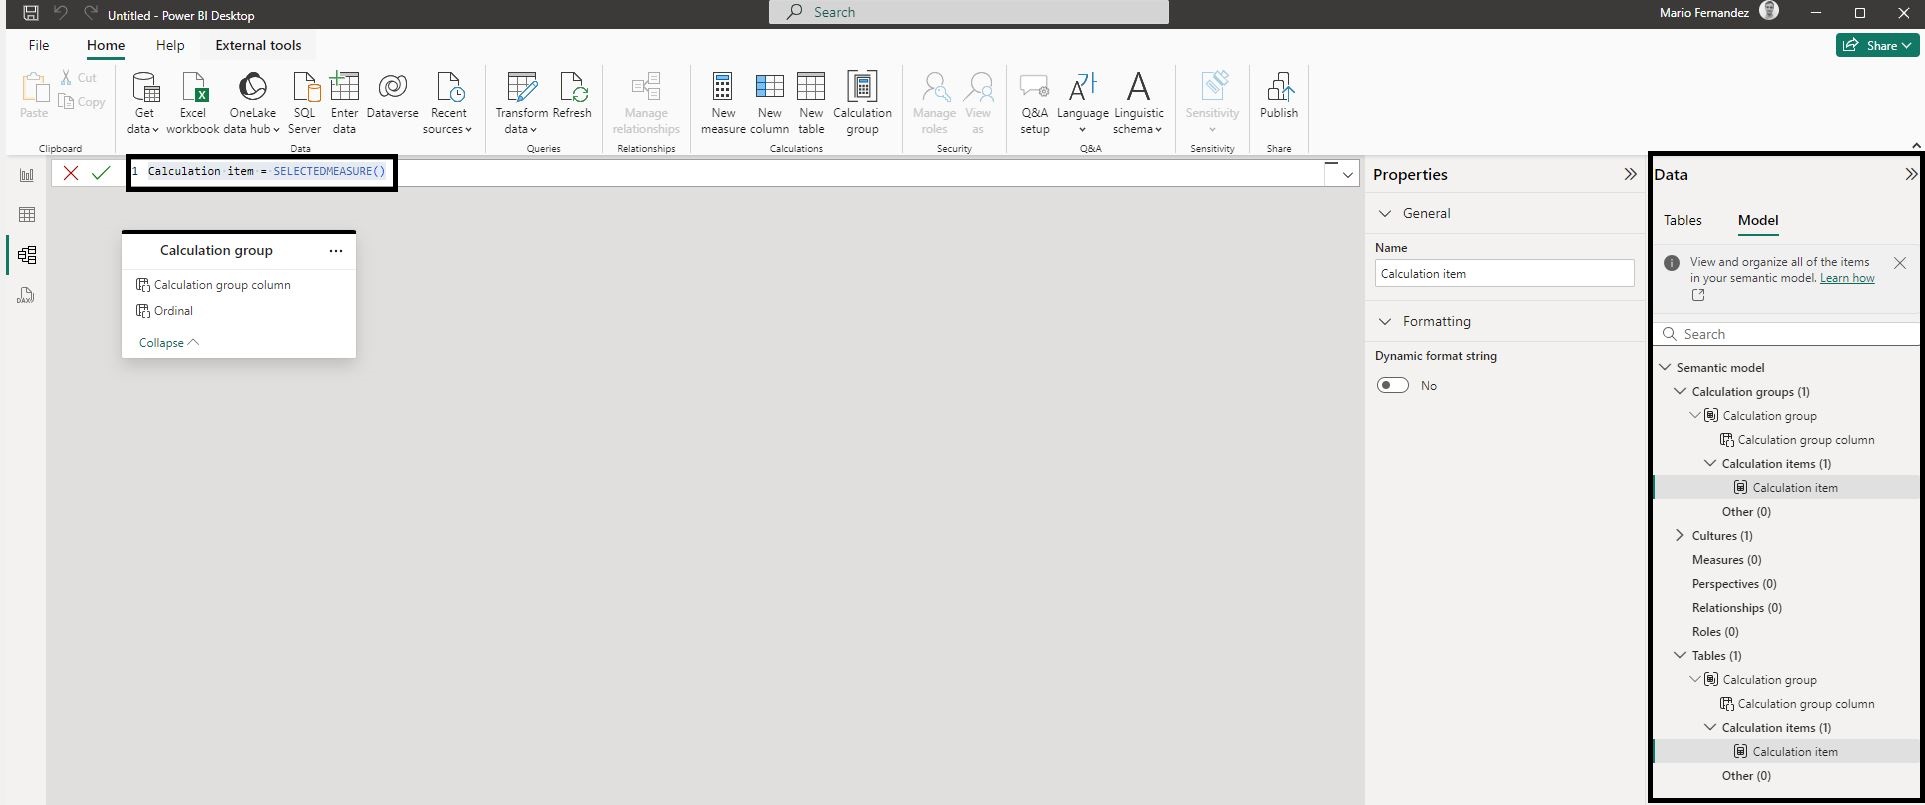
- Configuration: In the Data pane you’ll find the configuration of your semantic model and Calculation group. Within Calculation Items you can write DAX formulas using the “SELECTEDMEASURE()” function instead of specifying individual measures like Sales Units or Sales Values.

Figure 3: Data Pane
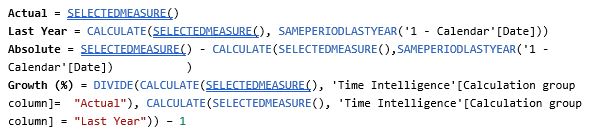
- Add New Calculation Items: Right-click on Calculation Item and select New Calculation Item.Define the DAX formulas for each Calculation Item. For this example, we’ll create four measures:

Figure 4: DAX Measures
Using Calculation Groups in Reports
- Once you’ve created your Calculation group, it will appear in your model. In our example, we’ve named it “Time Intelligence” and you can use in your report as shown below.
- Configure your Matrix: Go to the Visualization pane and select the Matrix visual. Now set it up:
Rows: Add the Date field (for example, the year and month from your calendar table).
Columns: Add the Calculation group columns.
Values: Add a measure, such as sales units.
- Replicate the matrix: Copy and paste the matrix visual and change the measure (units, values or price).
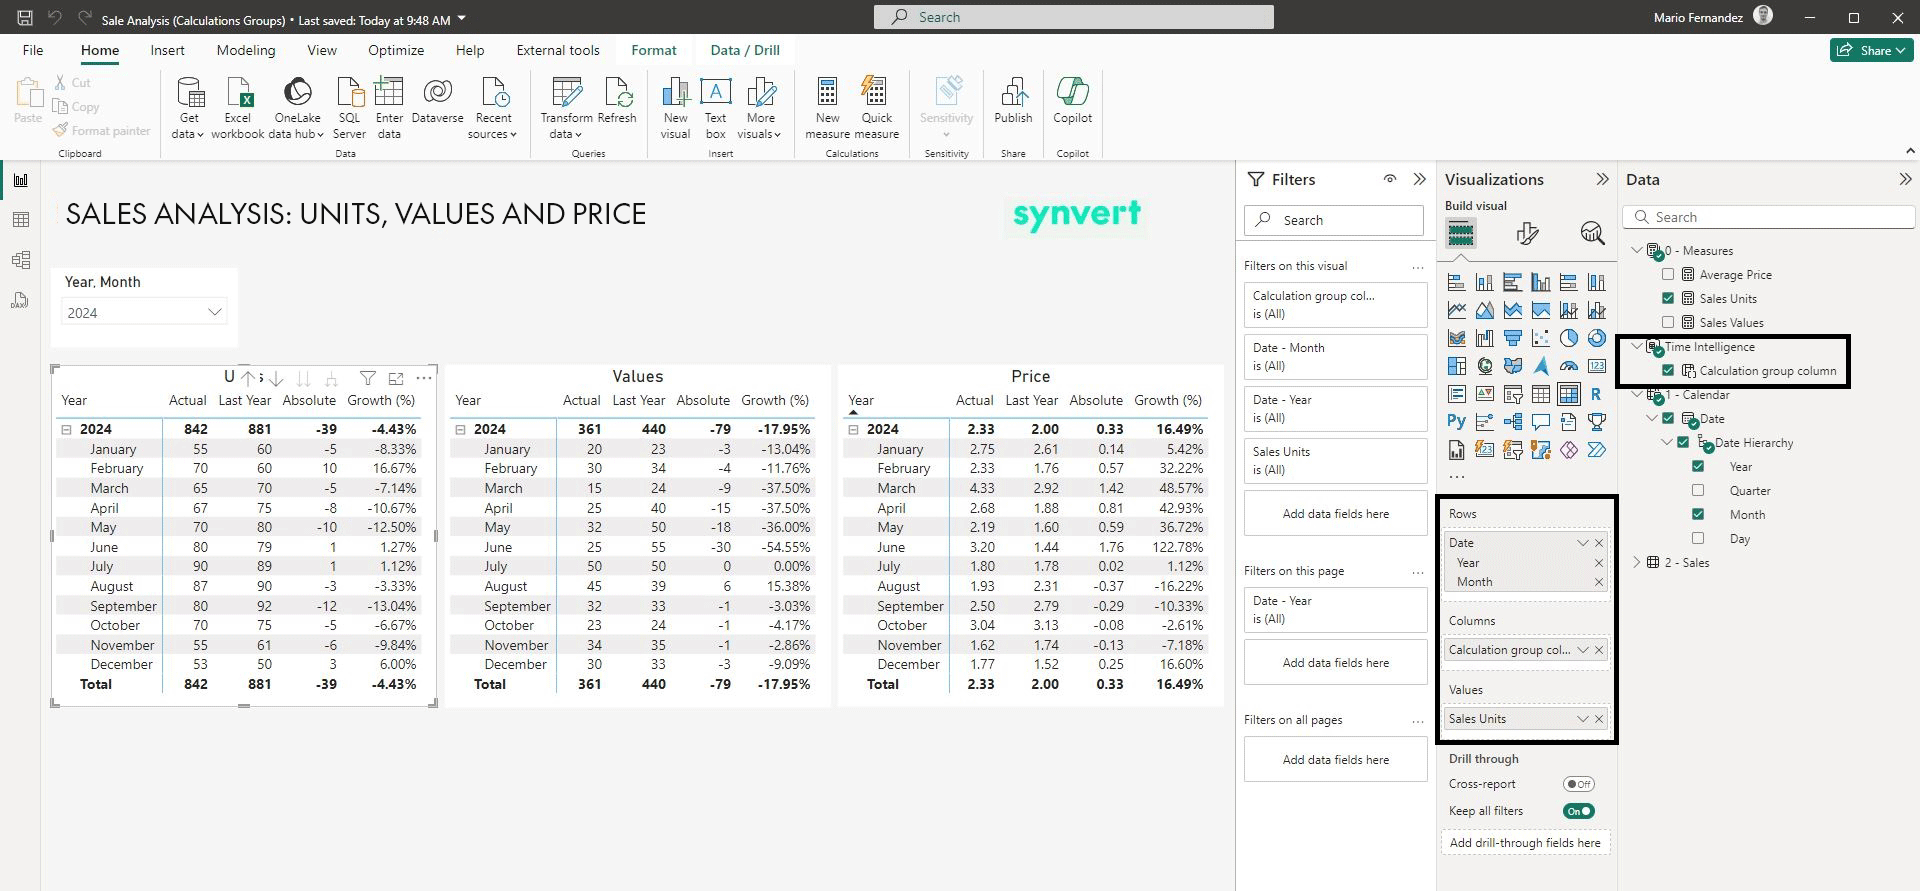
Figure 5: Use of Calculation Groups in Reports
Conclusion
Calculation groups in Power BI Desktop are an invaluable tool for anyone working with complex data models, allowing you to streamline your workflows, reduce redundancy, and maintain consistency across your reports.
Whether you’re dealing with time intelligence calculations or other complex scenarios, this feature provides a powerful solution that can greatly enhance your reporting capabilities.
If you need support with Calculation groups or any other Power BI functionality, don’t hesitate to reach out to us. Our experienced team of certified experts is ready to take your reports to the next level with impactful visualisations that deliver actionable insights.