17 Jun 2021 Advanced Auditing in HDP and Cloudera
We are managing a Hortonworks Data Platform (HDP) 3.1 cluster for one of our customers, and recently we had a requirement for the creation of a detailed audit report for the HDP cluster (check our blog for more entries related to HDP, especially this blog post and this other one or if you are a KNIME user, you might be interested in this blog).
1. Requirement
The requested audit report had to have user level information, audit entries including accessed service, and time and resource utilisation details of each session. We analysed existing audit solutions in the cluster, and we concluded that the existing platform would not be able to cater to this requirement.
So, we decided to build a custom auditing solution on top of the HDP cluster to meet the customer requirements. In this blog, we will have a look at the approach we took to build this solution, and we will also review how CDH/CDP has more advanced auditing mechanisms, and how we could build similar custom solutions on top of it.
Here are the fields we would need in the report, and their descriptions:
Username: Username of the user in the company
Full Name: Name of the user
Email id: Email id of the user
Service: The big data service accessed by the user
Access Time: The time when the user accessed that particular service
CPU Usage: In case of YARN based runs, CPU consumed by the user
RAM Usage: In case of YARN based runs, RAM consumed by the user
2. Challenges
The auditing in HDP is governed by Ranger. Ranger audits can be written to both Solr and HDFS. Audits to Solr are primarily used to enable search queries from the Ranger Admin UI. The Ranger Admin UI provides a tab for Access audit called ‘Access’, which provides Service activity data for all policies that have Audit set to On.
Figure 1: Ranger UI – Access Tab
These access logs can be partially used, but Ranger UI does not allow this data to be exported into any format. This necessarily meant that we could view the access logs, but could not export it for reporting purposes.
Another challenge was that these access logs did not have user level information that was required in the report, such as users’ full name and email id. This data would only be in a user identity provider, which in this case was Active Directory.
Recording and recovering the resource utilisation details was yet another challenge. In case of YARN workloads, we had to recover the CPU and RAM utilisations. This was not possible in Ranger, as it does not record this information. Resource utilisation for applications are recorded in YARN RM, which is viewable from the YARN Resource Manager UI. Again, this is not exportable from the UI.
Let’s summarise our challenges:
- No provision to build a custom access report from Ranger UI
- Ranger access logs not exportable from UI
- Detailed user information to be retrieved from external active directory
- Resource utilisation details not exportable from YARN RM UI
- Merge all these datasets from various sources into a single report
3. Custom Audit Solution
To achieve the desired result, we architected a custom automated solution that would get daily data from Ranger, Active Directory, and YARN history server into HDFS; and then create Hive tables on top of it. This would create a data store that could be used to create audit reports using custom Hive queries.
As the first step, we confirmed that Ranger’s “Audit to HDFS” option is enabled for all services (YARN, Hive, HBase, etc). Also, the path where audit files are created in HDFS is controlled with the property “xasecure.audit.destination.hdfs.dir”. Both these properties can be found in the configurations of the respective service, and can be tweaked via the Ambari UI.
Figure 2: Audit to HDFS properties in Ambari
Once these properties are set and the services are restarted, Ranger will start auditing these services in HDFS under the path we configured. The hierarchy of the audit files enables us to create a Hive table called “ranger_audit” on top of these files, with 2 partition columns:
- Component (service named folders like yarn, hiveserver2, etc.)
- Date (daily folders created under each component folder)
Figure 3: Ranger HDFS logs – 1st level partition (by service)
Figure 4: Ranger HDFS logs – 2nd level partition (by date)
We created the “ranger_audit” Hive table (thanks to JSON Serde) and were able to query this Ranger audit data in real time.
Now, we needed to get user data from Active Directory into a Hive table and refresh it on a daily basis. Since the cluster nodes are using Active Directory for authentication via SSSD, using the ldapsearch tool to get the required data from AD was not difficult.
What was slightly tricky was to parse through the huge data coming in as a response, get the required data (full name, username, email id) per user, and push it to a delimited file. Using our consultants’ expertise in Linux and shell, we used awk commands to get the required result. This resulting delimited file was then pushed into an external path in HDFS, and another Hive table called “user_details” was created on top of it.
To get the YARN resource utilisation, we decided to use the YARN Rest APIs. We called the Cluster Application API from the YARN Resource Manager Rest APIs to get all the applications executed during a time period (in our case, this was the previous day). The resulting output is a complicated JSON. We pushed this output file into HDFS and created another Hive table called “yarn_applications” on top of the files, partitioned on date.
We joined the user_details, ranger_audit, and yarn_applications tables on the username column, and furnished all required columns using a custom Hive query to have our final report. In fact, the customer was delighted, since we provided them with additional information which was much more detailed and helpful for audit and tracing a user session.
The final report had the below fields:
Username | Full Name | Start Time | End Time | Service | Application Name | Application Id | RAM Usage | CPU Usage |
|---|
The tables we create in this solution also have the power of getting more detailed, aggregated or summarised reports based on use case and requirements. For example, the yarn_applications table has 35 columns covering a yarn application’s every detail captured throughout its lifetime. Including this in a customized Log analytics solution to find root cause of a failed Spark or MR application is a classic example of how much more we could do with this solution.
Also, we can have customised charts like the ones below, built with our dataset to be included in the Utilisation report.
Figure 5: Visualizing the audit results with custom charts
We orchestrated the daily data refresh using simple CRON and a shell file for simplicity, but for a more advanced execution, we could also use other orchestration and workflow applications like Apache Oozie, Apache Airflow, etc.
Automated execution of the reporting query to generate the final report and send it to the auditor/management daily as an email via a SMTP server can also be incorporated in the script itself.
4. Auditing in Cloudera CDH/CDP
While the mentioned auditing challenges exist in HDP clusters, Cloudera has achieved significant custom auditing and reporting capabilities in the CDH and CDP solutions.
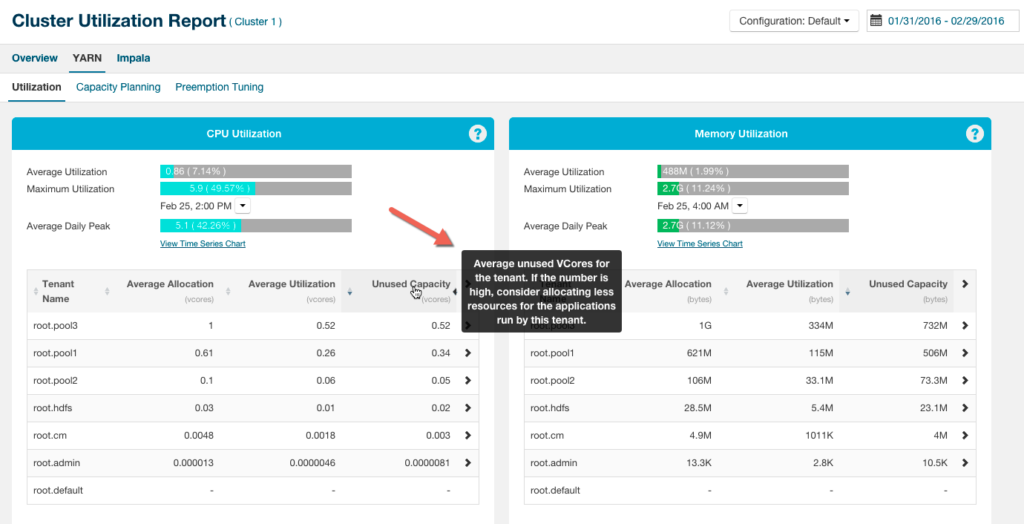
Cloudera Manager provides a Cluster Utilization Report that aggregates utilisation for the entire cluster and also breaks out utilisation by tenant, which is either a user or a resource pool. You can configure the report to display utilisation for a range of dates, specific days of the week, and time ranges.
Figure 6: Cluster Utilization Report
If you wish to export the data from this report, you can build custom reports based on the same metrics data, using the Cloudera Manager Admin console or the Cloudera Manager API. It allows custom reports to be created using the tsquery language, and also allows the building of comprehensive dashboards with charts.
Though this feature provides the ability to create custom reports for utilisation, access audits cannot be incorporated here.
If you are running on CDH, Cloudera Navigator provides secure real-time auditing. The Navigator Audit Server creates a complete and immutable record of cluster activity (in its own database) which is easy to retrieve when needed. Compliance groups can configure, collect, and view audit events that show who accessed data, when, and how.
The Cloudera Navigator console can be accessed from the Cloudera Manager Admin Console, or directly on the Navigator Metadata Server instance.
But as customers upgrade to CDP, Cloudera Navigator will no longer be auditing these events, and in turn, Ranger will be responsible to maintain the audit and access logs, which again as we saw previously, will need our custom solution for detailed audit reporting.
We see that though these solutions are in-built, audit requirements can vary from customer to customer and audit to audit. For example, we still cannot have a combined report with audit, utilisation, and active directory data, similar to the one we built previously in this article. We could use Cloudera Navigator Rest APIs to fetch more granular information, and combine it with other datasets to have a similar report.
Conclusion
In this article, we have seen the challenges with auditing in HDP, and how we built a custom audit reporting solution for HDP. We also reviewed how Cloudera CDH/CDP mitigates these challenges, and explored the reasoning for why we would still need customisations on top of it to meet customers’ security requirements.
Such an automated and robust solution not only achieves the desired outcome, but it also opens endless possibilities to include other columns in the existing report, or create new aggregated reports such as utilisation based on a company’s departments, or the possibility of integrating this with Grafana or a BI tool such as Power BI to have fancy dashboards in the future. This is possible, since the custom solution is flexible enough to incorporate changes to the logic or the data retrieved from cluster/AD, or the data model itself.
Here at ClearPeaks, our expert Cloudera certified consultants can build custom solutions on top of existing platforms, and we adapt perfectly to our customers’ requirements and needs.
We hope you found the reading useful and enjoyable. Please contact us if you’d like to know more about what we can do for you.


