22 Oct 2018 ETL Monitoring Dashboard in OBIEE using ODI tables
Oracle Data Integrator (ODI) and Oracle Business Intelligence Enterprise Edition (OBIEE) combine perfectly in an Oracle BI apps environment, offering users powerful advantages in Real-time Monitoring and Actionable Insights. In this blog article, we are going to explain the important metadata tables that can be modelled according to business requirements, and also see a few sample reports to get an idea of what the dashboards look like.
1. Use cases
- Business users want to be able to verify the success of a data load for any specific day if discrepancies are found, before raising a flag.
- Developers want a real-time monitoring dashboard showing load progress.
- Management wants to know the low-performing and long-running tasks in a data load in order to reduce the total time.
- Business needs insights on how data loads are performing over a period of time so as to address recurring errors.
2. ODI Metadata tables
We are going to model two fact tables, one for the load plan and another for the session. Below we can see the level of data each table contains:
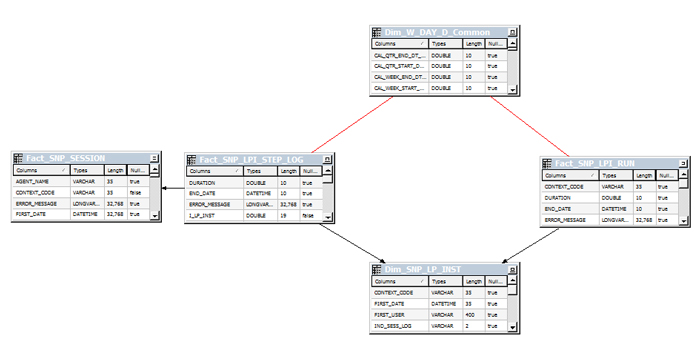
SNP_LP_INST: Names of load plans and each instance of the load plan. An instance of a load plan is considered as one specific execution of the load_plan/load_plan_ID. This is going to be the load plan dimension in our model.
SNP_LPI_RUN: Start time, end time, duration and status at each load_plan_instance + Run level. A load plan instance can be restarted multiple times in case of failure and this table has data at each run level. This is going to be one of the facts in our OBIEE model.
SNP_LPI_STEP_LOG:Data about start time, end time, # of rows processed, # of inserts, # of updates and much more. Data granularity is at load_plan_step + LP_instance +Run level. Records with a valid SESS_NO are associated to scenarios, and those without a valid SESS_NO can be a logical step in a load plan and it is a collection of scenarios. This can be joined to the SNP_LPI_STEP table to get more details about the steps in a load, but this is not part of our model.
SNP_SESSION:Data at a session number level. The SESS_NO column can be joined to SESS_NO column in SNP_LPI_SEP_LOG by establishing a link between load_plan ~ load_plan_instance ~ sessions in the load_plan.
SNP_SESS_TASK_LOG:This table captures details at task level for each session and can be joined with SNP_SESSION table on SESS_NO. We will not be using this table in our model, but it can be handy to capture details, even at task level.
The different statuses and their meanings in the above tables are: ‘D’ – ‘Done’, ‘R’ – ‘Running’, ‘W’ – ‘Waiting’, ‘E’ – ‘Error’, ‘M’ – ‘Warning’, ‘A’ – ‘Done in previous run’.
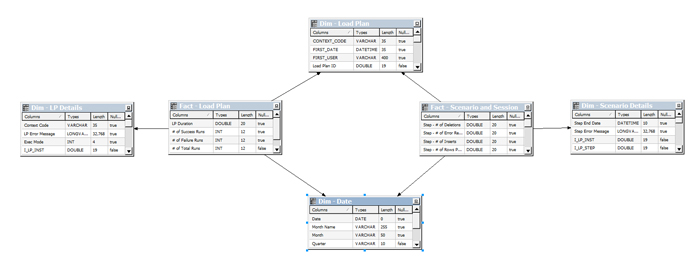
We are going to model SNP_SESSION and SNP_LPI_STEP_LOG as one single logical fact using the OBIEE Implicit join functionality; we are also going to create a degenerate dimension out of these tables to cater for important attributes needed for reporting.
3. OBIEE model
Optionally, we can join with BI Apps the W_DAY_D table to do historic reporting.
3.1. Physical Layer:
3.2. BMM Layer:
Dim – LP Details and Dim – Scenario Details are the degenerate dimensions created out of the respective fact tables.
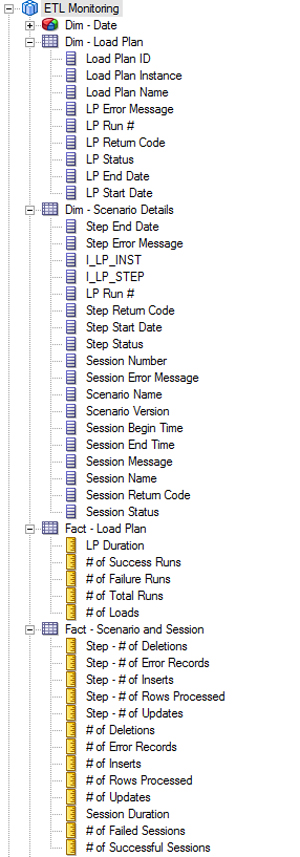
3.3. Presentation Layer:
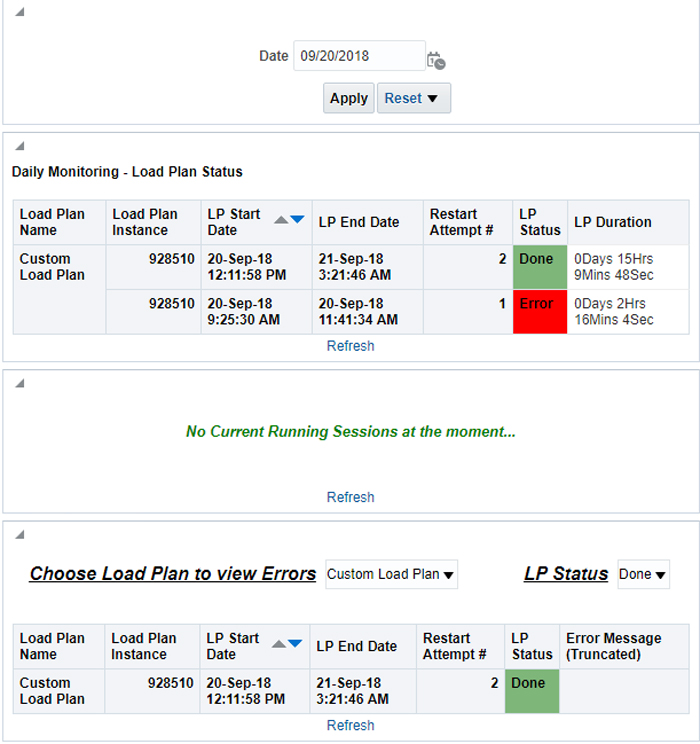
3.4. Sample Reports:
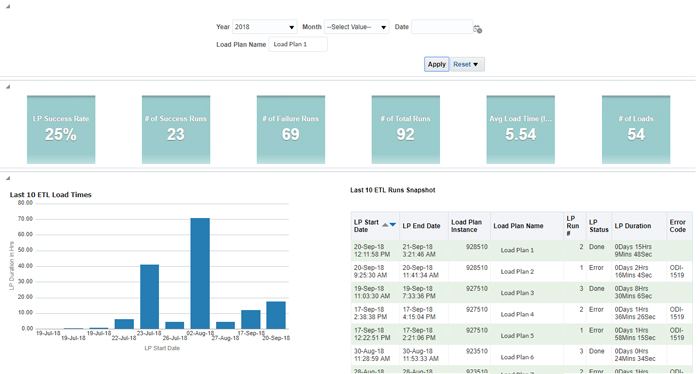
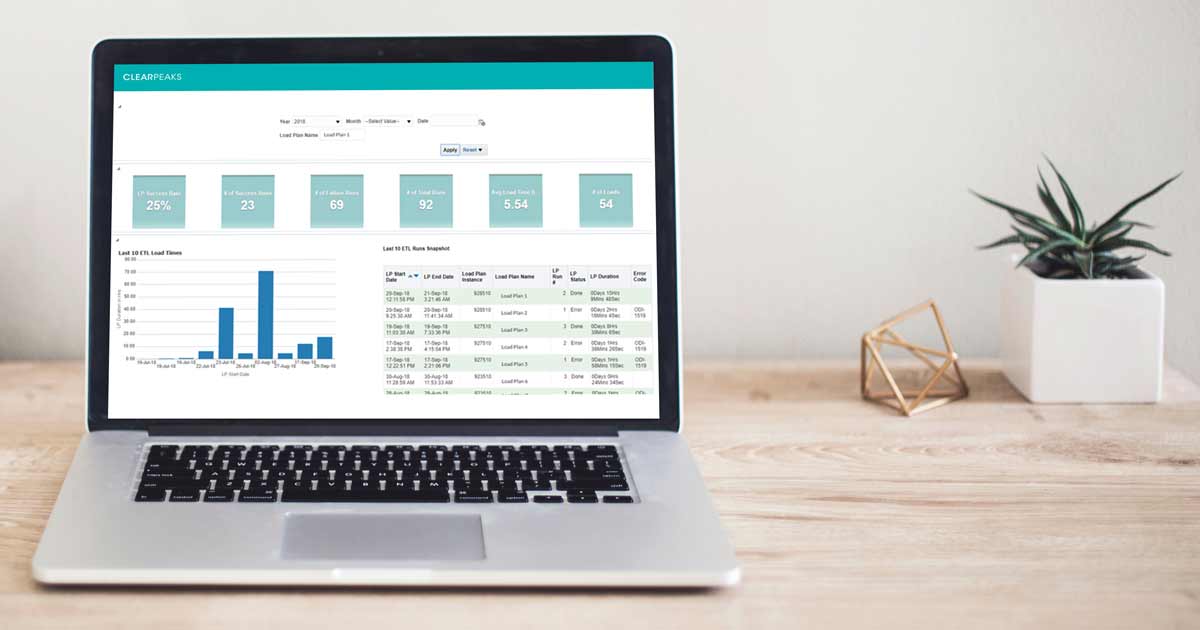
We can create two separate dashboard pages, one for real-time monitoring and one for insights. A glimpse of the ETL monitoring dashboard would look like this:
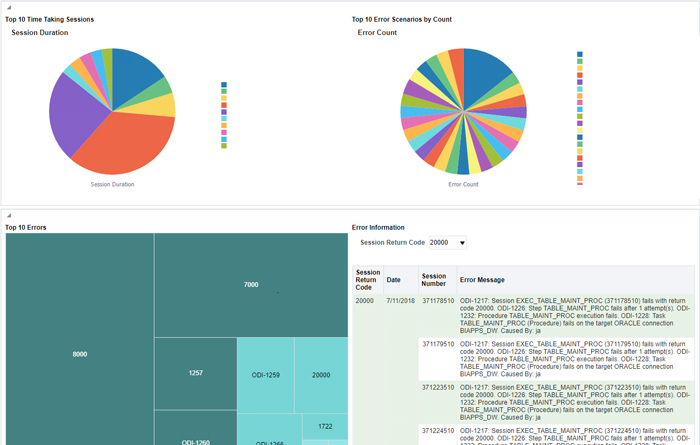
A glimpse of the Insights dashboard would look like this:
Many more reports can be made by bearing the business problems in mind – something ClearPeaks excels at!
Conclusion
This blog article has tried to keep the model simple whilst achieving valuable insights from the underlying data. As there is no data warehouse ETL involved, development of this model is also quite simple and doesn’t take long. Timely fixing of recurring errors can ensure a smooth load plan by reducing manual efforts and developers’ time.
Note: The words ETL and ELT are interchangeable in this blog article.

